Discrete Random Variables and Probability Distributions
Random Variables and probability distributions
A random variable is a mathematical function that assigns a numerical value to each outcome of a random experiment. The proper notation for defining a random variable are X, Y, and Z. The classic example of a random variable is as follows:
Let X be the number of times a coin lands on heads in a single coin flip
\[X = \begin{cases} 1 & \text{if heads} \\ 0 & \text{if tails} \end{cases}\]
This can be thought of as our random variable X can take on the outcomes of x = 1, and x = 0.
The numerical outcomes I assign to heads and tails do NOT directly influence the calculation of the probability. I could have done the following:
X = 500 if the flip of the coin is a head X = 25 if the flip of the coin is a tail
But the numeric values of 1 and 0 are more intuitive of course. We try to make this mapping an intuitive as possible so things like the mean (expected value) of the distribution actually makes some sense. The expected value of X makes more sense when our mapping is 1 and 0 instead of 500 and 25. The numbers you assign to the outcomes become the specific values that the random variable X can take on. These values are then the key ingredients for calculating important statistical measures like calculating expected values, variances, ect.
The specific numeric values you choose to map to the outcomes do not affect the probabilities of the outcomes themselves.
The mapping must be one-to-one, so each unique outcome (Heads or Tails) is consistently assigned a unique number.
Probability distributions
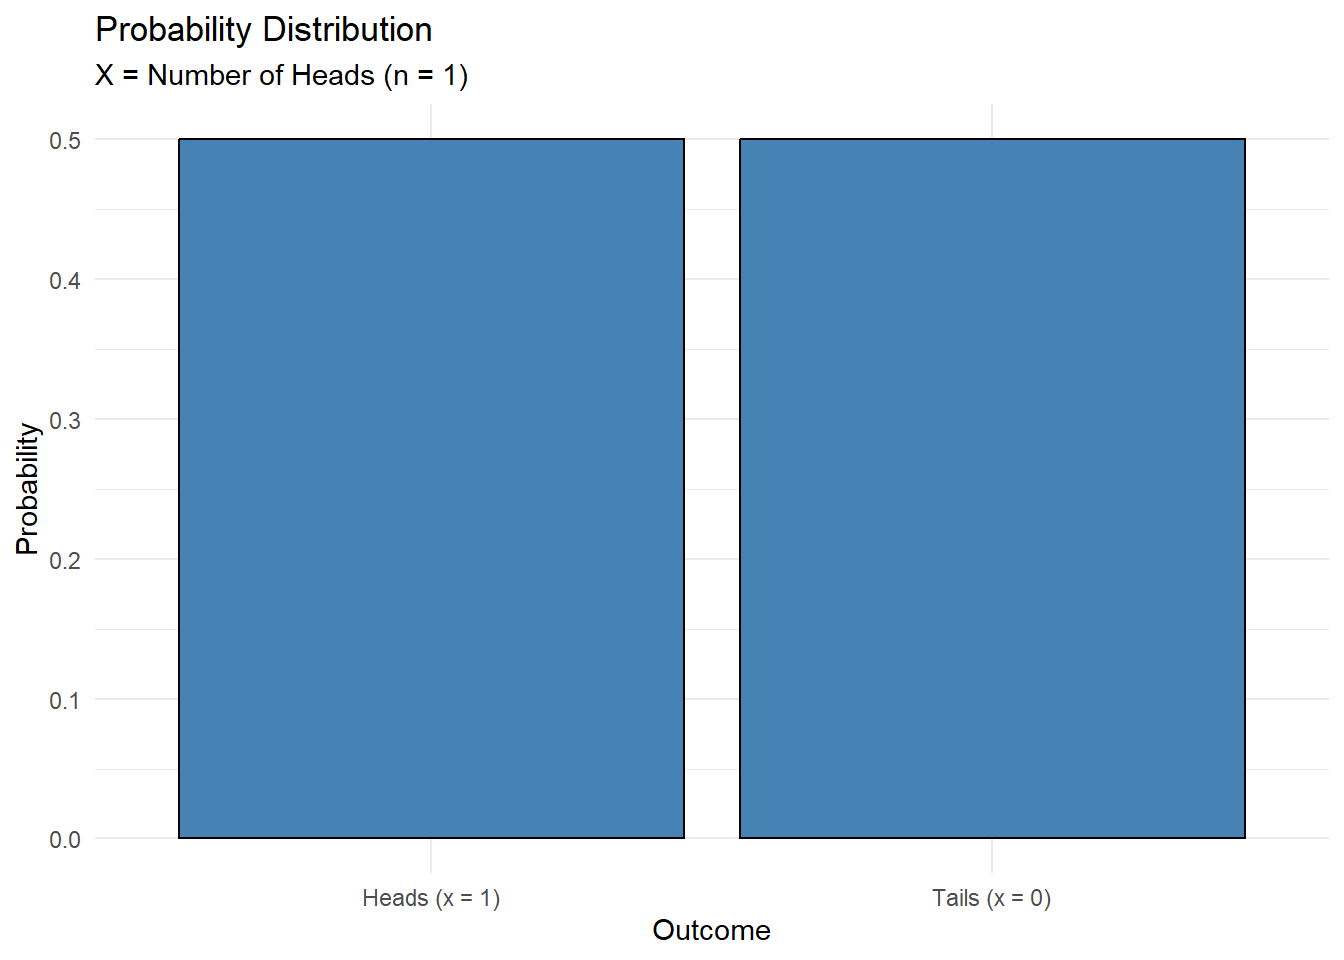
The probability distribution can be seen below. Note that the x-axis is is the outcome (number of heads), and the mapped probabilities is on the y-axis.
P(H) = P(X = 1) = .5
P(T) = P(X = 0) = .5
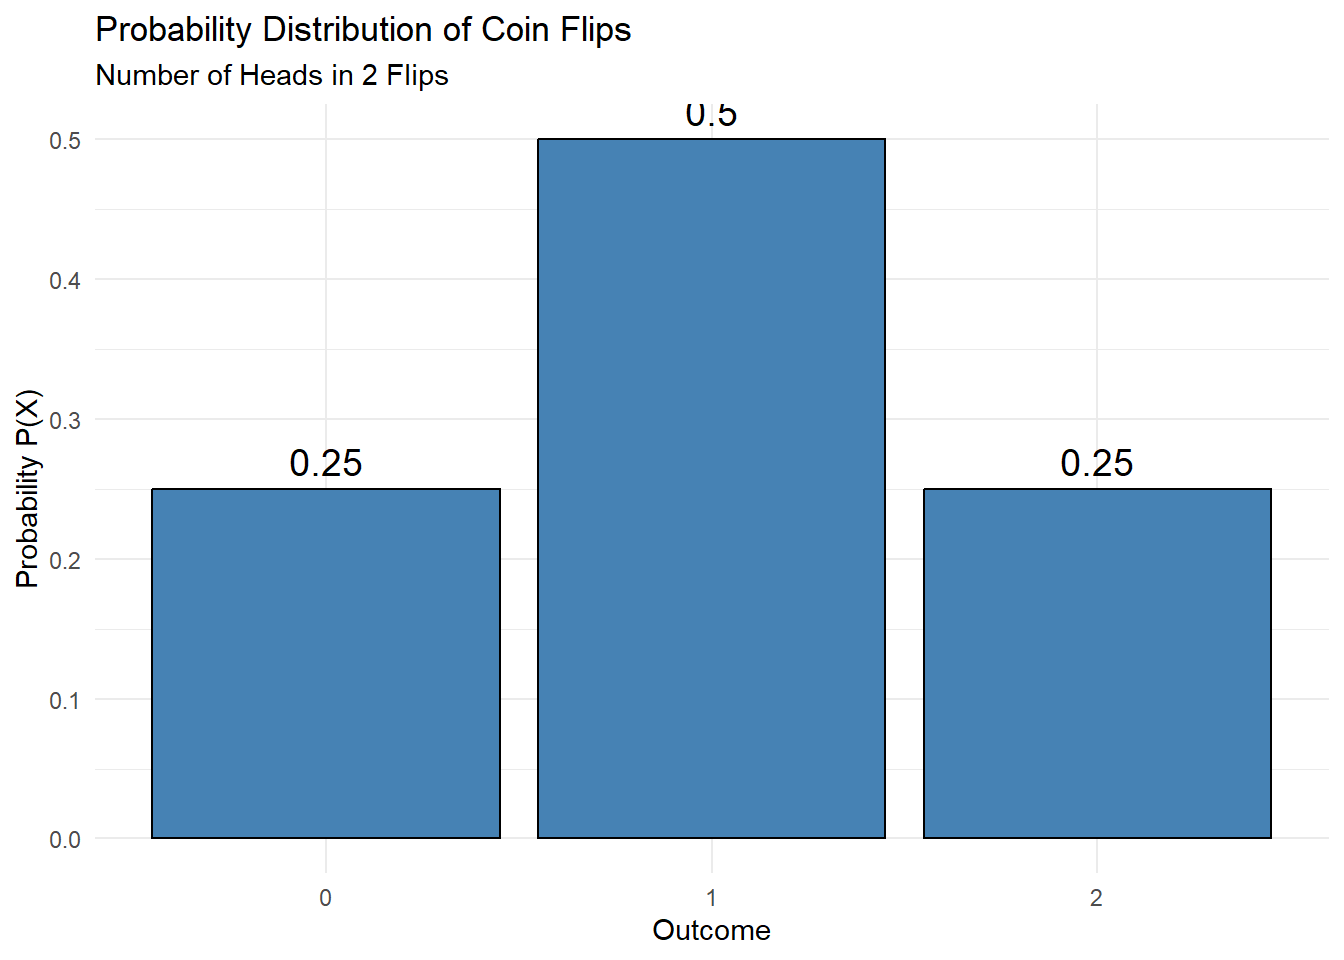
Let’s expand our random variable. Our new random variable is X = the number of heads flipped after flipping 2 coins, where x can equal 0, 1, 2.
The mapping would then be as follows:
P(2 heads) = P(X = 2) = .25
P(heads/tails or tails/heads) = P(X = 1) = .50
P(2 tails) = P(X = 0) = .25
x (outcome) is plotted on the x-axis of the probability distribution, and the mapped probability is plotted on the y-axis. The probability is not directly calculated from the values X = 2, but it maps the associated probability for what happens at X = 2