Homework-4
solutions
How to clone your repo
You clone your homework-4 repo exactly how we have been cloning AEs! Please see Moodle for more information.
How to turn your HW in
Homework is turned in via Gradescope. You can find the Gradescope HW-3 button on our Moodle page. Please remember to select your pages correctly when turning in your assignment. For more information, please see on Moodle: Submit Homework on the Gradescope Website.
How to format your Homework
For each question (ex. Question 1), put a level two (two pound signs) section header with the name of the question.
For questions with multiple parts (ex. a, b, c), please put these labels in bold as normal text.
For example…
Question 1
a
This homework is due Sunday, November 2nd at 11:59pm.
You will need to have at least 3 (meaningful) commits by the end of your homework assignment. Please practice proper version control techniques by committing and pushing after each answered question.
Packages
Start your document by making a Packages header, and copying this code and code chunk over into your .qmd file.
Use message: false and warning: false as code chunk arguments for this code chunk so you don’t get all of the extra unnecessary information when you render your document.
Exercise 1 (15 points)
- An experiment tested three different diets (k=3) on a total of N=15 subjects (5 per diet). The resulting one-way ANOVA table can be seen below. However, it’s missing a lot of information!
Using the context of the problem, fill in the ___ below by typing in the values.
I want you recreate this table with the appropriate values by interting a table into your Quarto document. You can do this by:
– Going to the Visual tab in the top left corner of the .qmd file
– Click the Table dropdown menu (same row as the Visual tab)
– Click Insert Table…
– Select your appropriate size
You can either fill in the values in the Visual tab, or go back to the Source tab.
Use the pf() function to estimate the p-value. Include this as a code chunk in your sasignment.
| Source of Variation | Degrees of Freedom (df) | Sum of Squares (SS) | Mean Square (MS) | F-Ratio | P-value |
|---|---|---|---|---|---|
| Between Groups (Diet) | 2 | 100 | 50.00 | 6.00024 | 0.797 |
| Within Groups (Error) | 12 | 100 | 8.333 | ||
| Total | 14 | 200 |
Exercise 2 (20 points)
For the remaining exercises, we are going to use the ToothGrowth in R. The response is the length of odontoblasts (cells responsible for tooth growth) in 60 guinea pigs. Each animal received one of three dose levels of vitamin C (0.5, 1, and 2 mg/day). We want to investigate if the mean tooth length across guinea pigs are different across dose. Specifically, we want to find out which means are different. Run the following code below to ensure that dose is treated as a categorical variable. Use ToothGrowth_dose for the questions below. We are going to assume that one guinea pig does not influence the other.
- Using R, report a tibble that has the means and standard deviations of length for each
dosegroup below.
# A tibble: 3 × 3
  dose   mean    sd
  <fct> <dbl> <dbl>
1 0.5    10.6  4.50
2 1      19.7  4.42
3 2 26.1 3.77- Use your information from part a to check the equal variance assumption. Show your calculation.
4.50 / 3.77 < 2[1] TRUEThe ratio of the largest to smallest sd is < 2. We do not have evidence that the equal variance assumption is violated.
c. See the anova-cor AE. Manipulate the code used to re-create a normal-qq plot for each of the three levels of dose. Next, assess the normality assumption.
ToothGrowth_dose |>
      ggplot(
        aes(sample = len)) +
      stat_qq() +
      stat_qq_line() +
      facet_wrap(~ dose) + # Replace 'Species' with your grouping variable
      labs(title = "QQ Plots of Bill Length by Species",
           x = "Theoretical Quantiles (what we would expect to see from a Z)",
           y = "Ordered data") +
      theme_minimal()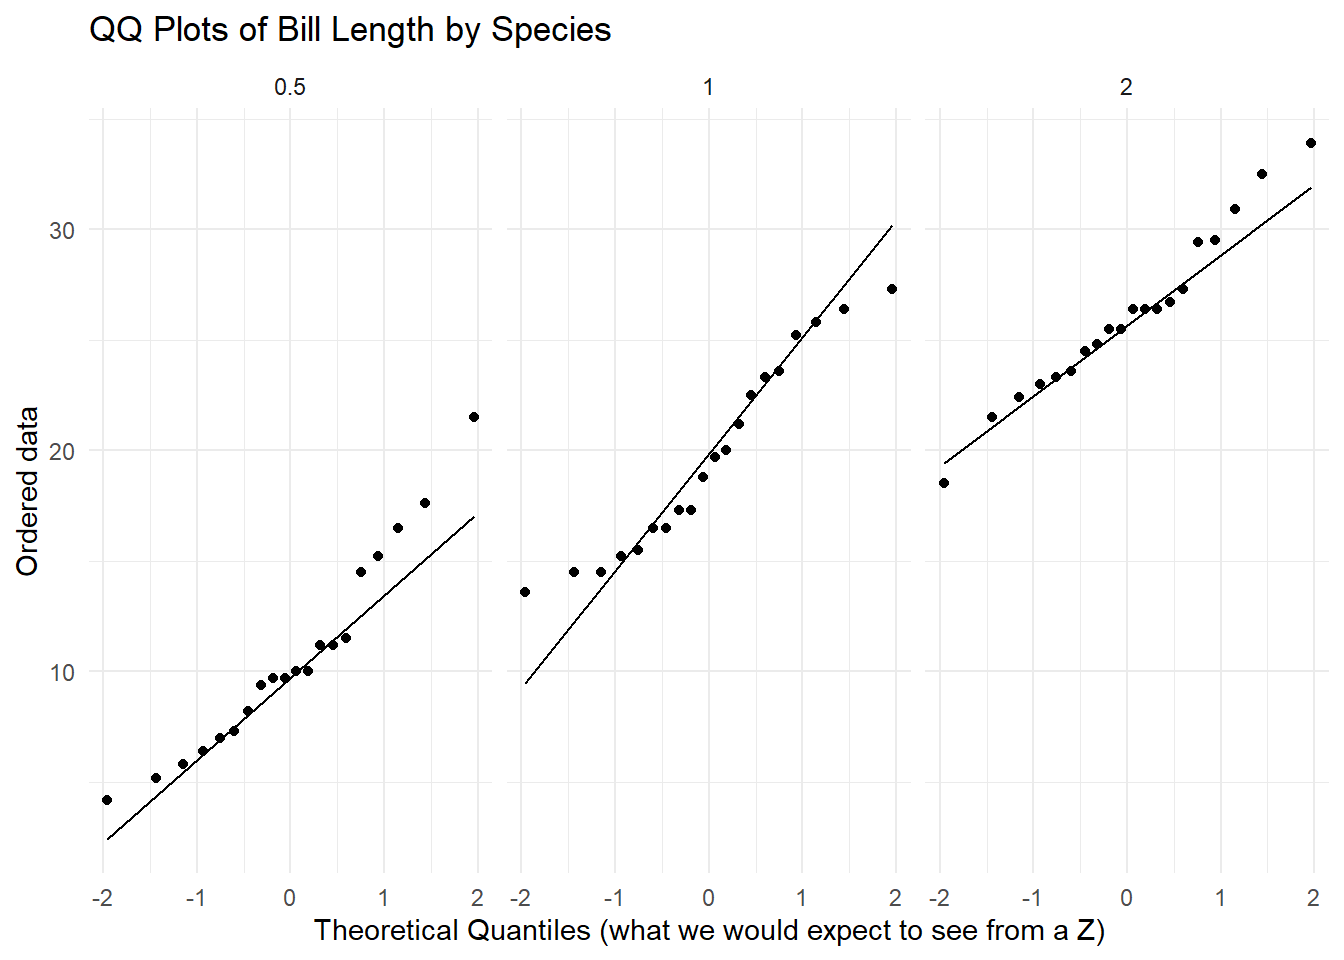
- Now, use R-code to generate an Anova table. Report the table below. Use inline code to report the F value and p-value in a sentence separate from your Anova table.
# A tibble: 2 × 6
  term         df sumsq meansq statistic   p.value
  <chr>     <dbl> <dbl>  <dbl>     <dbl>     <dbl>
1 dose          2 2426. 1213.       67.4  9.53e-16
2 Residuals    57 1026.   18.0      NA   NA
tidy_anova <- tidy(anova_model)
dose_row <- tidy_anova[tidy_anova$term == "dose", ]
# Our F-value is `r dose_row$statistic`, and our p-value is `dose_row$p.value`Our F-value is 67.4157379, and our p-value is dose_row$p.value
- In 1-2 sentences, justify if TukeysHSD is appropriate to continue answering our research question.
Yes. Our p-value is very small, giving us evidence that at least one population mean tooth growth length is different. Therfore, we can use Tukey’s HSD to figure out which combination of means are actually different.
f. Regardless of your answer in part e, conduct TukeysHSD in R. Report the results below. Which pairwise combinations of means are reported to be statistically different?
TukeyHSD(anova_model) Tukey multiple comparisons of means
95% family-wise confidence level
Fit: aov(formula = len ~ dose, data = ToothGrowth_dose)
$dose
diff lwr upr p adj
1-0.5 9.130 5.901805 12.358195 0.00e+00
2-0.5 15.495 12.266805 18.723195 0.00e+00
2-1 6.365 3.136805 9.593195 4.25e-05All three pairwise combinations are statistically significantly different based on the Tukey’s HSD output.
Exercise 3 (15 points)
- We are going to calculate a 95% confidence interval for dose 1 - dose 0.5. We are simply going to do a single comparison, and not make confidence intervals for all pairwise combinations.
Using a t-distribution calculate a 95% confidence interval below. Show your work. That is, us qt() to find your multiplier, show how you calculate the standard error, etc.
qt(.975, df = 19)[1] 2.093024-
Report your confidence interval calculated in part a with the confidence interval calculated using TukeysHSD in exercise 2 part f, below. Which interval is wider?
In 2-4 sentences, explain why one interval is wider than the other.
This interval is more narrow than the one calculated by Tukey’s because it uses a t-distribution instead of the studentised range distribution, which controls the family-wise error rate for multiple comparisons. The t-test assumes this is a single, independent test.