HW 2 - Foundations + the Practice of Inference
Packages
Tips
Remember that continuing to develop a sound workflow for reproducible data analysis is important as you complete this homework and other assignments in this course. There will be reminders in this assignment for you to Render your document. The last thing you want to do is work an entire assignment before realizing you have an error somewhere that makes it so you can’t compile your document. Render after each completed question.
After each question, please commit, stage all files, and push your changes to your GitHub repo. You need at least 3 meaningful commits to earn full credit on this assignment.
It is not a meaningful commit all at the very end of your assignment.
Exercises
Exercise 1: Office budget
Milliions of records maintained by the office of budget in a particular state indicate that the amount of time elapsed between the submission of travel vouchers and the final reimbursement of funds has approximately a normal distribution with mean 36 days and standard deviation of 4 days.
- In words, define the random variable from the context above.
Solution
Let X be the elapsed time between submission and reimbursement.
- In proper notation, write out how the random variable is distributed.
Solution
\[ X \sim N(36, 4) \]
- Here is a visualization of your population distribution for this question. Suppose you want to know the probability that your random value takes on a value larger than 55. Write out his probability statement using proper notation.
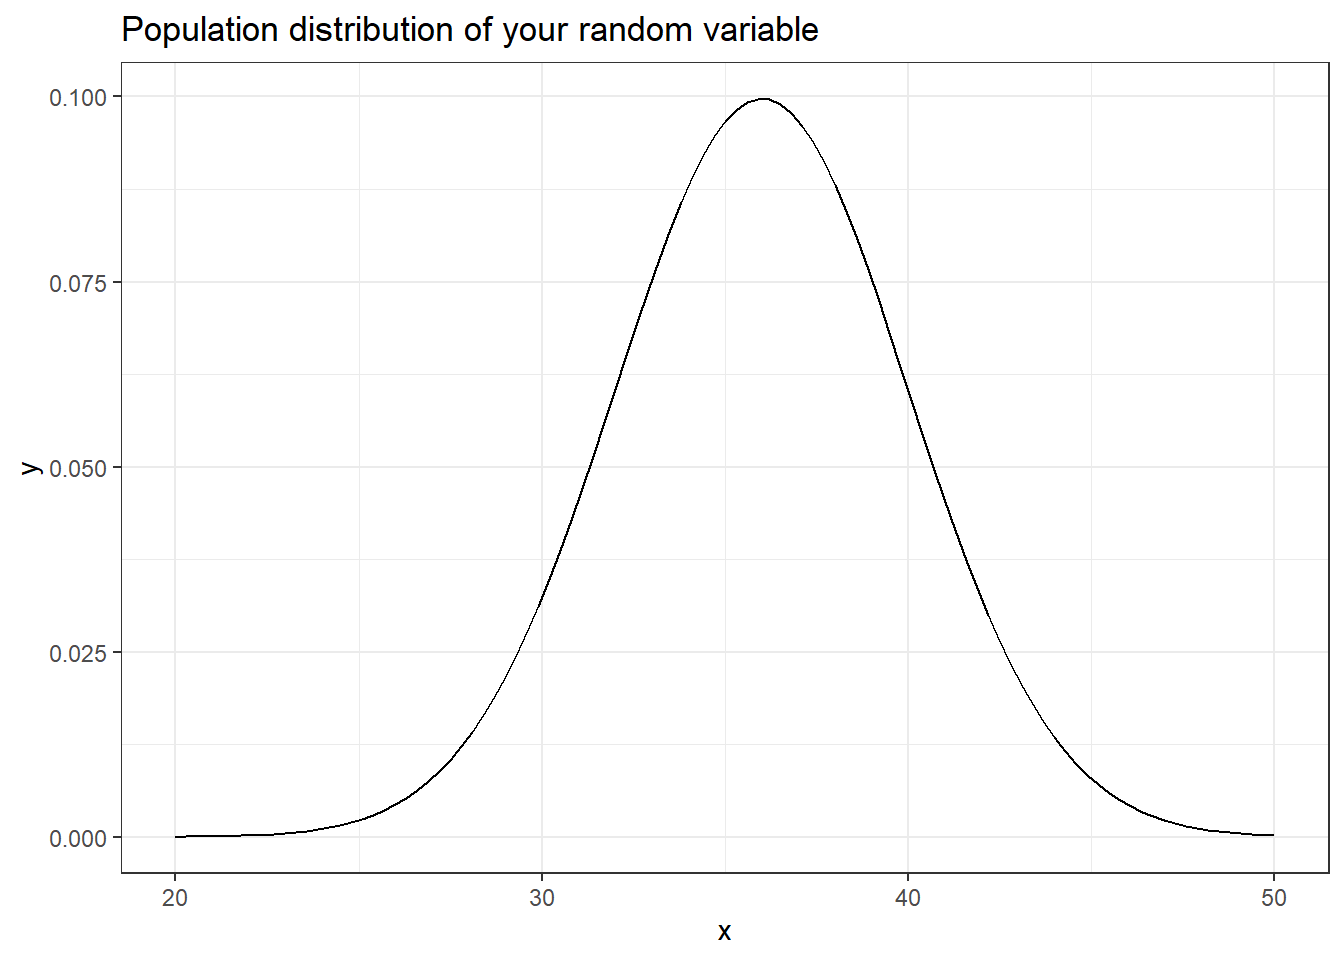
Solution
P(X > 55)
- In your own words, describe what a probability distribution is…
A probability distribution is a distribution of outcomes a random variable can take on with associated probabilities.
- Estimate the probability that your random value takes on a value larger than 55? Justify your answer. Note, you do not have to perform any calculations to answer this question.
The probability that X > 55 is a very small number (<0.0001). This is because probability is calculated as area under the curve, and we have basically 0 (but not 0) area under the distribution that is larger than 55.
- What is the probability that your random value takes on a value that is equal to 40? Justify your answer. Note, you do not have to perform any calculations to answer this question.
Solution
The probability that X = 40 is 0. This is because the area under a single point is 0…or that because a continuous variable can take on an infinite number of values within a given range, meaning the probability at any one specific point becomes infinitesimally small, essentially equaling zero.
Exercise 2: Office Budget
- Suppose that you are a researcher, and take a random sample of 100 office records and you calculate your sample statistic. What is the proper notation for your statistic?
Solution
\[\bar{x}\]
- Knowing the population distribution from exercise 1, write out how the sample statistic is distributed (sampling distribution of the mean), in proper notation. Include 3-5 sentences justifying the the center, spread, and shape of the distribution.
Solution
\[ \bar{x} \sim N(36, \frac{4}{\sqrt{100}} ) \]
The sampling distribution of \(\bar{x}\) is going to be normal if the population distribution is normal. It is also going to have the same center (36). However, the spread of the sampling distribution is smaller, and is calculated by looking at \(\frac{s}{\sqrt{n}}\).
Exercise 3: Skittles
Skittles are a brand of chewy, fruit-flavored candies that come in many colors and flavors. The original skittles colors consisted of Red, Orange, Yellow, Green, and Purple. The company claims that they put the same amount of each color of skittles in their bags of candy.
You, as a Skittles enthusiast, question if this is really true. More specifically, you suspect that they are putting more Purple Skilttles in their bags of candy than they claim to be.
With this information, set up your null and alternative hypothesis. Write out each in both words and proper notation.
\(H_o\):
\(H_a\):
Solution
\(H_o\): \(\pi\) = 0.2
\(H_a\): \(\pi\) > 0.2
- Suppose you sneak into the factory, and take a random sample of 205 skittles. You found 47 purple skittles, and 158 skittles that were not purple. Below, in proper notation, write out your summary statistic.
Solution
\(\hat{p} = \frac{47}{205}\)
- Is the sampling distribution going to be normal, under the assumption of the null hypothesis? Justify your answer.
Solution
Yes. We can assume the independence assumption because we took a random sample, and our sample size is < 10% of the entire population of skittles. Under the assumption of the null hypothesis, we would expect 41 successes (purple skittles) and 164 failures (not purple skittles). Both of these values are larger than 10. Thus, we would expect the sampling distribution to be normal.
.2205 = 41 > 10 .8205 = 164 > 10
- Where is the sampling distribution going to be centered? Why does this make sense?
Solution
The sampling distribution is going to be centered at our null value of 0.2. This makes sense because we are assuming that the true proportion of purple skittles is 20%.
- Now, calculate your standardized test statistic that you will use to test your hypothesis above. Show your work!
Solution
\(Z = \frac{.229 - .2}{\sqrt{\frac{.2*.8}{205}}}\) = 1.07
- Finally, calculate your p-value. At the \(\alpha\) value of 0.05. Write an appropriate decision and conclusion in the context of the problem.
Solution
pnorm(1.07, 0 , 1, lower.tail = FALSE)[1] 0.1423097Based on a p-value of 0.142, we fail to reject the null hypothesis, and have weak evidence to conclude that the true proportion of purple skittles is greater than 20%.
Exercise 4 Random Sampling
Imagine a school with 5000 students, and you want to survey 50 students to get their opinion on the new basketball head coach.
- Describe how you would conduct a proper random sample to investigate your research question.
A random sample happens when each observational unit (student) in the population has an equal chance of being selected. As example of a random sample would be to assign a number to all 5000 students, and then use a random number generator to sample 50 of them.
- Describe a sampling scheme that would elicit bias in your results.
Standing outside a food hall on a Tuesday and selecting the first 50 students you see is a sampling scheme that could elicit bias. The probability that of being selected would vary based on student eating times, location on that day, etc.
Exercise 5: Class Question
Suppose that the board of Education came out with an assessment question, and they claimed that 50% of all students who take this question, actually get the answer correct. Wanting to test this, I assigned the question to my class, and observed 68 students get the answer correct, and 83 students get the answer incorrect.
Interpret the p-value in the context of the problem. Note, the interpretation of a p-value is different than writing a decision or a conclusion. For this problem, you may assume that the p-value is .352.
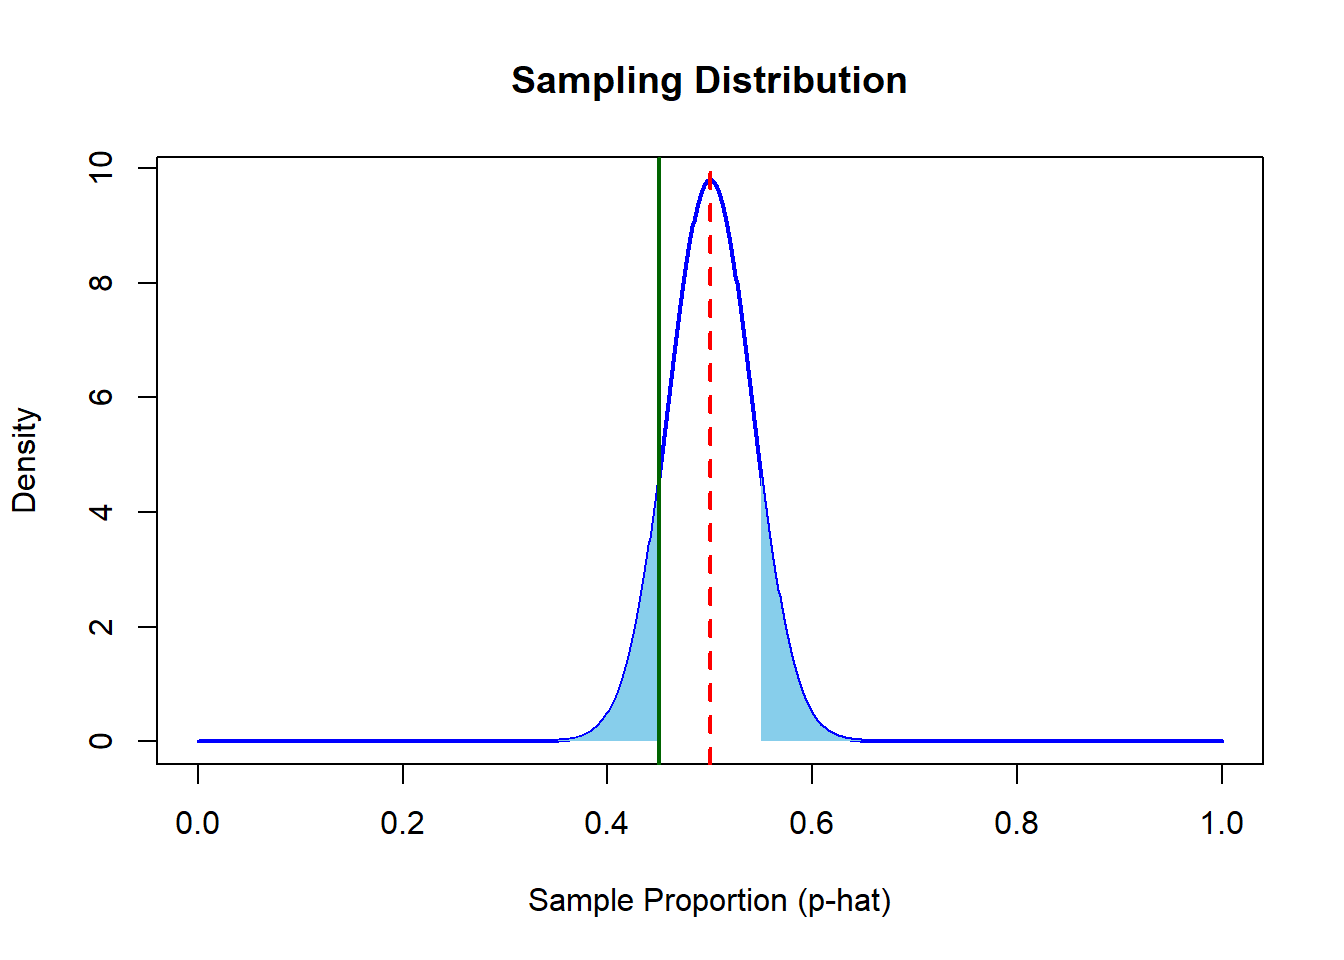
- Interpret the p-value in the context of the problem. Note, the interpretation of a p-value is different than writing a decision or a conclusion.
Solution
The probability of observing 45% of students get the question correct or less, and the the probability of observing 55% of students get the question correct or more, assuming that the true proportion of getting the question correct is 50%, is roughly .352%.