HW 2 - Foundations + the Practice of Inference
This homework is due Sunday, Sep 21 at 11:59pm.
Packages
Tips
Remember that continuing to develop a sound workflow for reproducible data analysis is important as you complete this homework and other assignments in this course. There will be reminders in this assignment for you to Render your document. The last thing you want to do is work an entire assignment before realizing you have an error somewhere that makes it so you can’t compile your document. Render after each completed question.
After each question, please commit, stage all files, and push your changes to your GitHub repo. You need at least 3 meaningful commits to earn full credit on this assignment.
It is not a meaningful commit all at the very end of your assignment.
Exercises
Exercise 1: Office budget
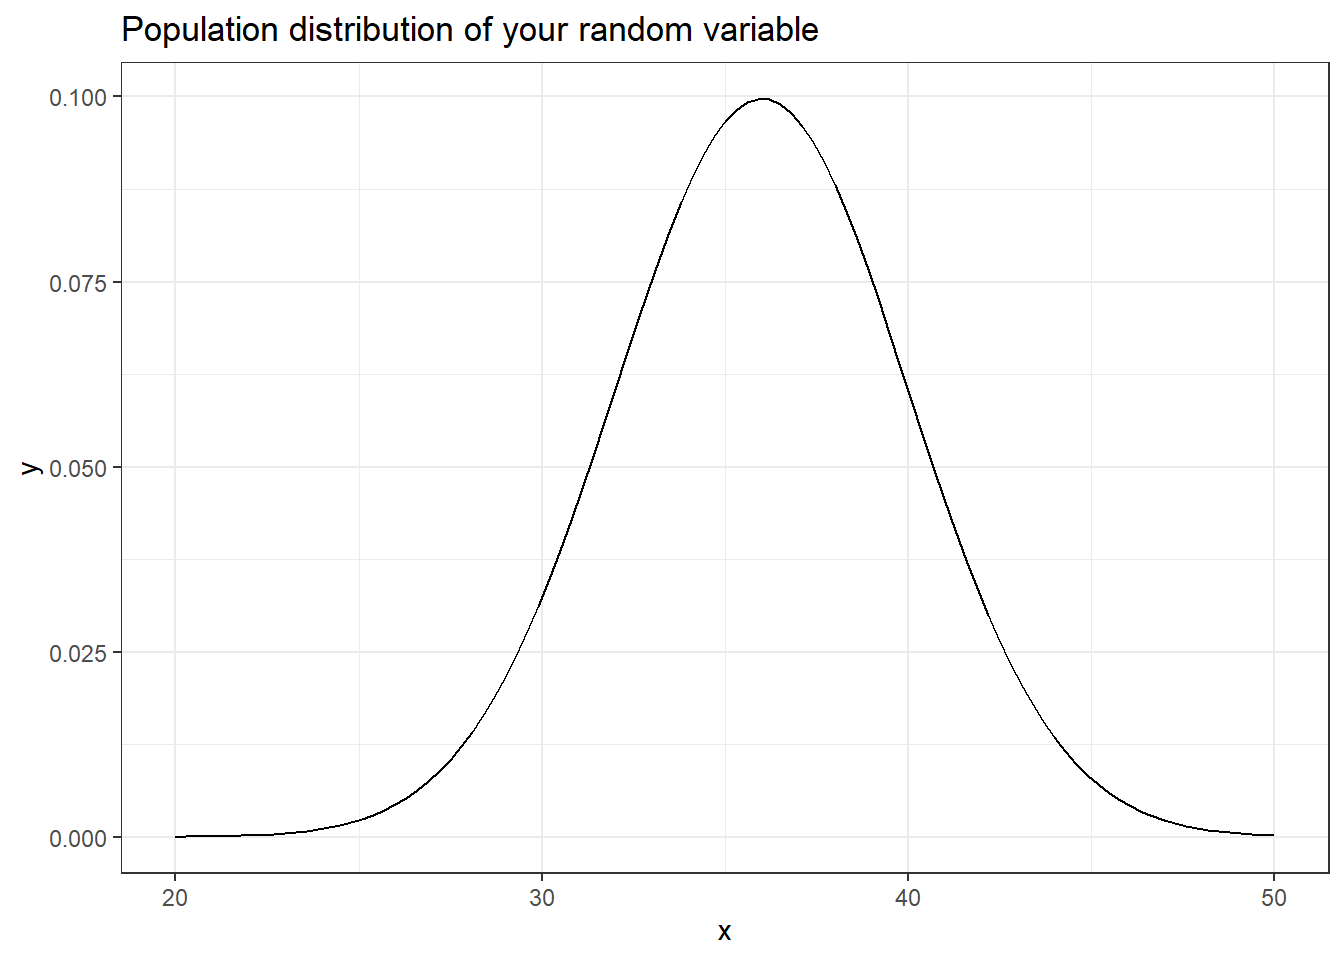
Millions of records maintained by the office of budget in a particular state indicate that the amount of time elapsed between the submission of travel vouchers and the final reimbursement of funds has approximately a normal distribution with mean 36 days and standard deviation of 4 days.
In words, define the random variable from the context above.
In proper notation, write out how the random variable is distributed.
Here is a visualization of your population distribution for this question. Suppose you want to know the probability that your random value takes on a value larger than 55. Write out this probability statement using proper notation.
In your own words, describe what a probability distribution is…
Estimate the probability that your random value takes on a value larger than 55? Justify your answer. Note, you do not have to perform any calculations to answer this question.
What is the probability that your random value takes on a value that is equal to 40? Justify your answer. Note, you do not have to perform any calculations to answer this question.
Exercise 2: Office Budget
Suppose that you are a researcher, and take a random sample of 100 office records and you calculate your sample statistic. What is the proper notation for your statistic?
Knowing the population distribution from exercise 1, write out how the sample statistic is distributed, in proper notation. Include 3-5 sentences justifying the the center, spread, and shape of the distribution.
Exercise 3: Skittles
Skittles are a brand of chewy, fruit-flavored candies that come in many colors and flavors. The original skittles colors consisted of Red, Orange, Yellow, Green, and Purple. The company claims that they put the same amount of each color of skittles in their bags of candy.
You, as a Skittles enthusiast, question if this is really true. More specifically, you suspect that they are putting more Purple Skittles in their bags of candy than they claim to be.
With this information, set up your null and alternative hypothesis. Write out each in both words AND proper notation.
\(H_o\):
\(H_a\):
Suppose you sneak into the factory, and take a random sample of 205 skittles. You found 47 purple skittles, and 158 skittles that were not purple. Below, in proper notation, write out your summary statistic.
Is the sampling distribution going to be normal, under the assumption of the null hypothesis? Justify your answer.
Where is the sampling distribution going to be centered? Why does this make sense?
Now, calculate your standardized test statistic that you will use to test your hypothesis above. Show your work!
Finally, calculate your p-value. At the \(\alpha\) value of 0.05. Write an appropriate decision and conclusion in the context of the problem.
Exercise 4: Random Sampling
Imagine a school with 5000 students, and you want to survey 50 students to get their opinion on the new basketball headcoach.
Describe how you would conduct a proper random sample to investigate your research question.
Describe a sampling scheme that would elicit bias in your results.
Exercise 5: Class Question
Suppose that the board of Education came out with an assessment question, and they claimed that 50% of all students who take this question, actually get the answer correct. Wanting to test this, I assigned the question to a random sample of students, and observed 68 students get the answer correct, and 83 students get the answer incorrect.
Below, you can see the associated visualition and p-value for this prompt.
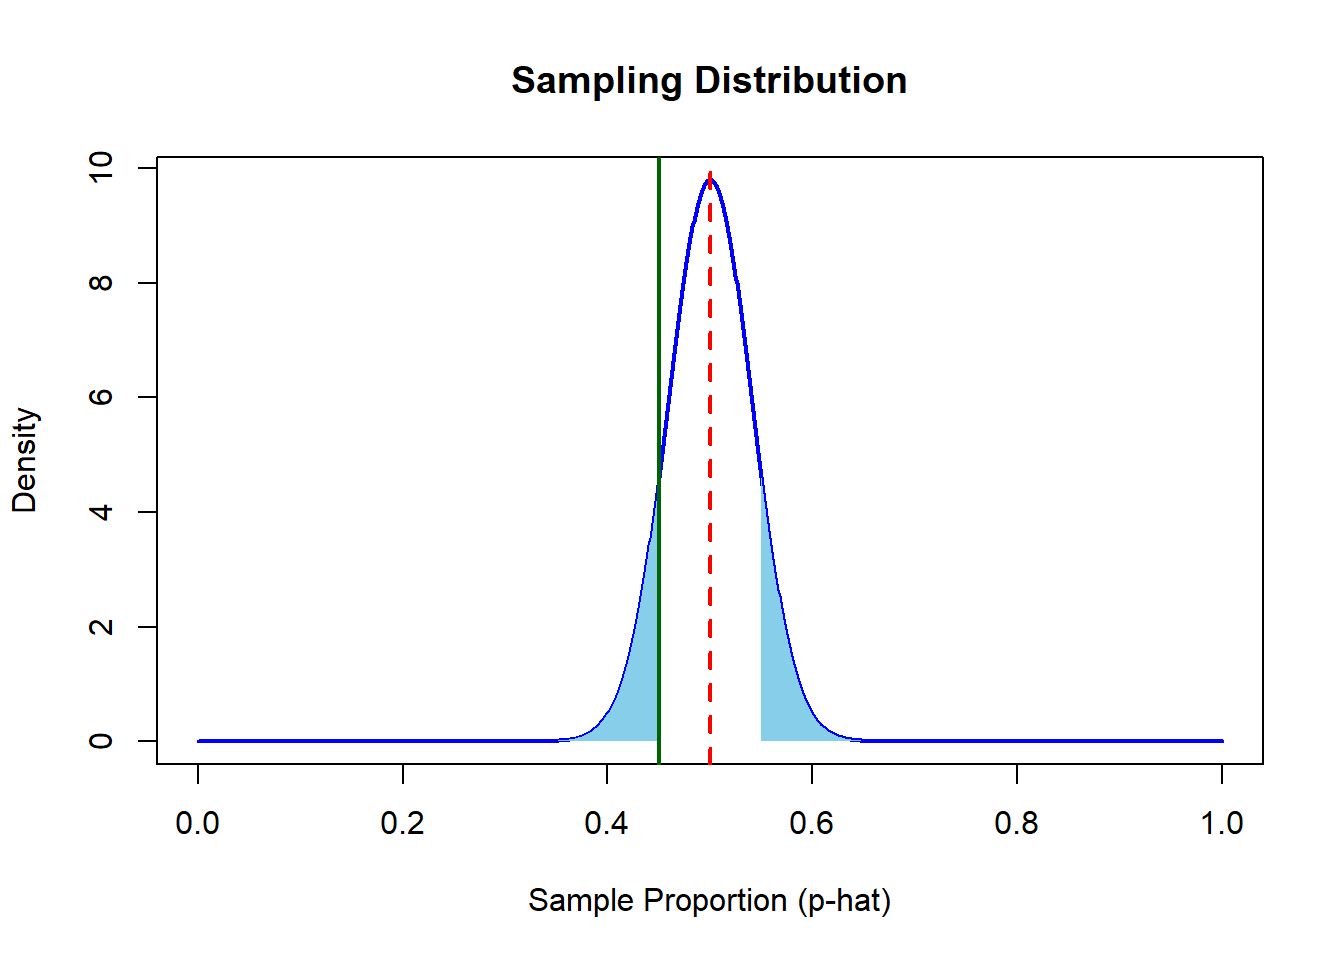
- Interpret the p-value in the context of the problem. Note, the interpretation of a p-value is different than writing a decision or a conclusion. For this problem, you may assume that the p-value is .352.
Submission
- Go to http://www.gradescope.com and click Log in in the top right corner.
- Log in with your school credentials.
- Click on your STA 511 course.
- Click on the assignment, and you’ll be prompted to submit it.
- Mark all the pages associated with exercise. All the pages of your homework should be associated with at least one question (i.e., should be “checked”). If you do not do this, you will be subject to lose points on the assignment.
- Do not select any pages of your PDF submission to be associated with the “Workflow & formatting” question.
The “Workflow & formatting” grade is to assess the reproducible workflow. This includes:
- linking all pages appropriately on Gradescope
- putting your name in the YAML at the top of the document
- Pipes
%>%,|>and ggplot layers+should be followed by a new line - You should be consistent with stylistic choices, e.g.
%>%vs|>
Grading
- Exercise 1: 13 points
- Exercise 2: 10 points
- Exercise 3: 22 points
- Exercise 4: 10 points
- Exercise 5: 6 points
- Workflow + formatting: 5 points
- Total: 66 points