Warning: package 'ggplot2' was built under R version 4.3.3
Warning: package 'tidyr' was built under R version 4.3.3
Warning: package 'readr' was built under R version 4.3.3
Warning: package 'dplyr' was built under R version 4.3.3
Warning: package 'stringr' was built under R version 4.3.3
Warning: package 'lubridate' was built under R version 4.3.3
– Quiz is due Tuesday (see Moodle)
– Homework later this week
– Statistics experience released
– Expect take-home grades by this Wednesday
– Final Exam is Dec 8th at 3:30 (expect an email this afternoon)
Warm up
A company HR department wants to know if the type of coffee an employee prefers (Black or With Milk/Cream) is independent of their primary method of commuting (Car or Public Transit).
What is \(H_o\), \(H_a\)?
Assuming the assumptions are met, what’s my statistic and distribution?
Warm up
A veterinary nutritionist wants to know if a new vitamin supplement increases the average distance a dog can run on a treadmill before tiring. They decide to test two different breeds: Border Collies and Beagles.
The goal is to test if the mean running distance of Border Collies is significantly different from that of Beagles.
What is \(H_o\), \(H_a\)?
Assuming the assumptions are met, what’s my statistic and distribution?
Questions
Learning objectives
What can we do when working with two quantitative variables?
– Summary statistics?
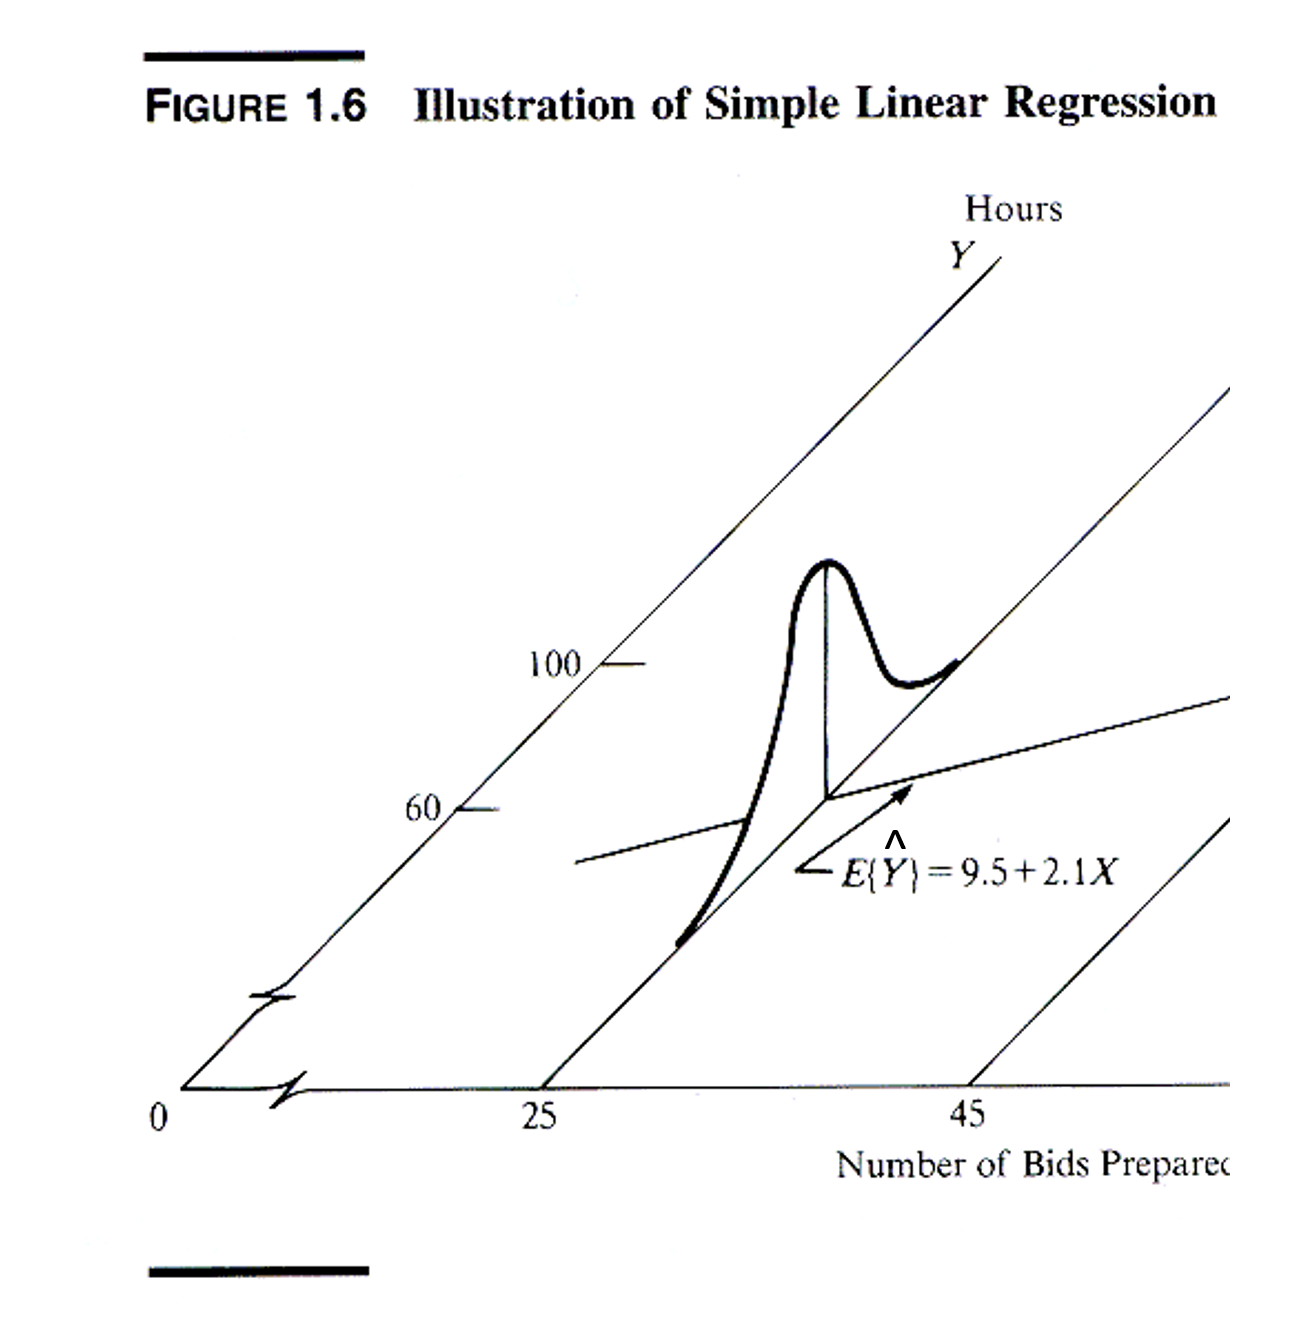
– What is simple linear regression?
– How a line of best fit is made
– How to talk about the line of best fit
We are reviewing exploratory data analysis
We will move to statistical inference in the following lesson
Airquality
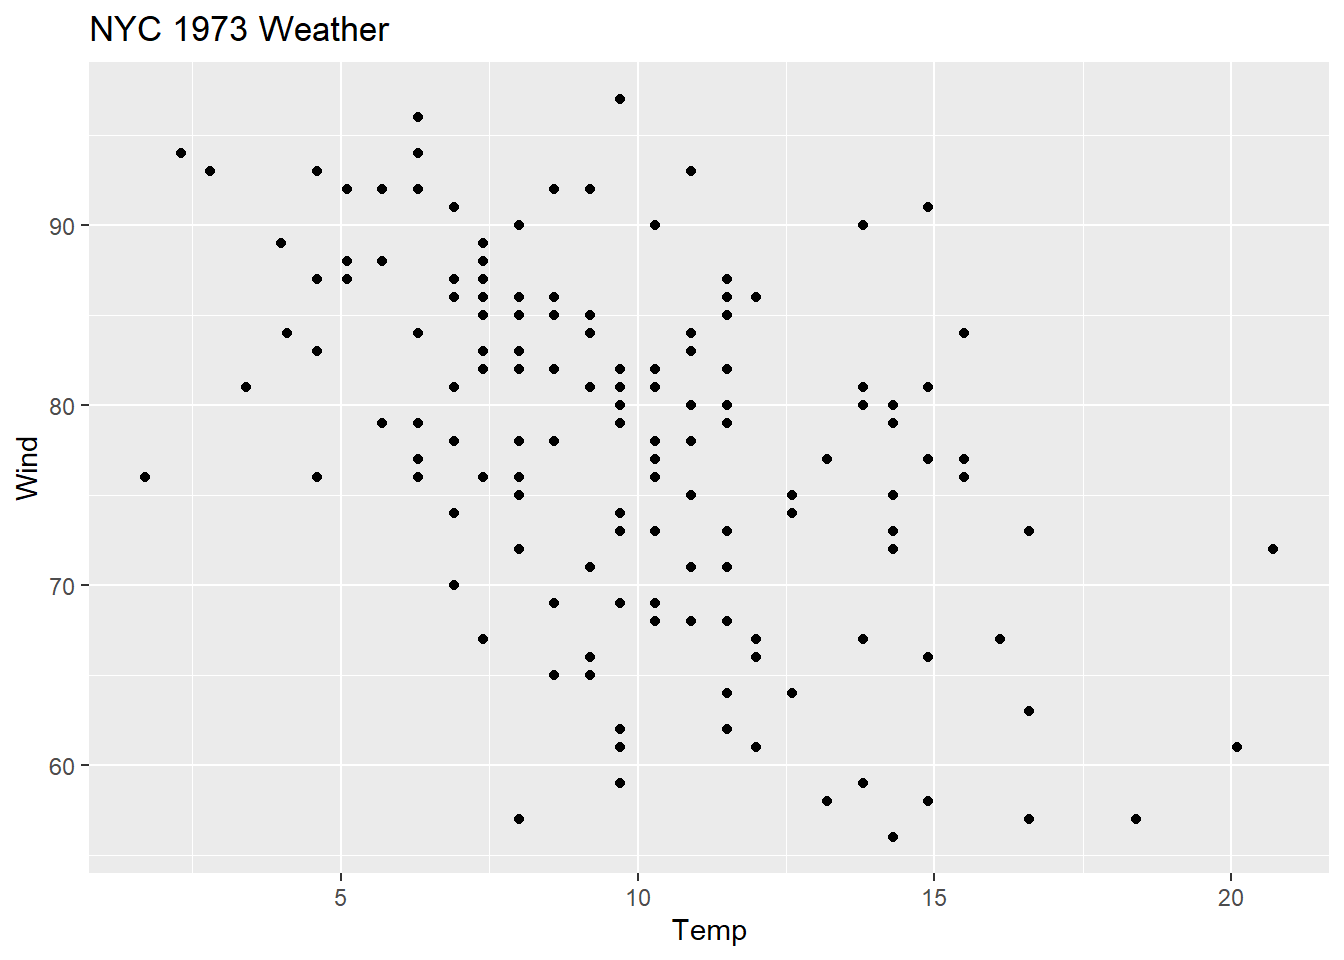
We are going to look at daily air quality measurements in New York from May through September in 1973. Specifically, we are going to look at the relationship between wind (mph) and temperature (F).
– Can I analyze these data using difference in means?
– Difference in proportions?
– What kind of plot can we make?
Plot the data
How can we summarize these data?
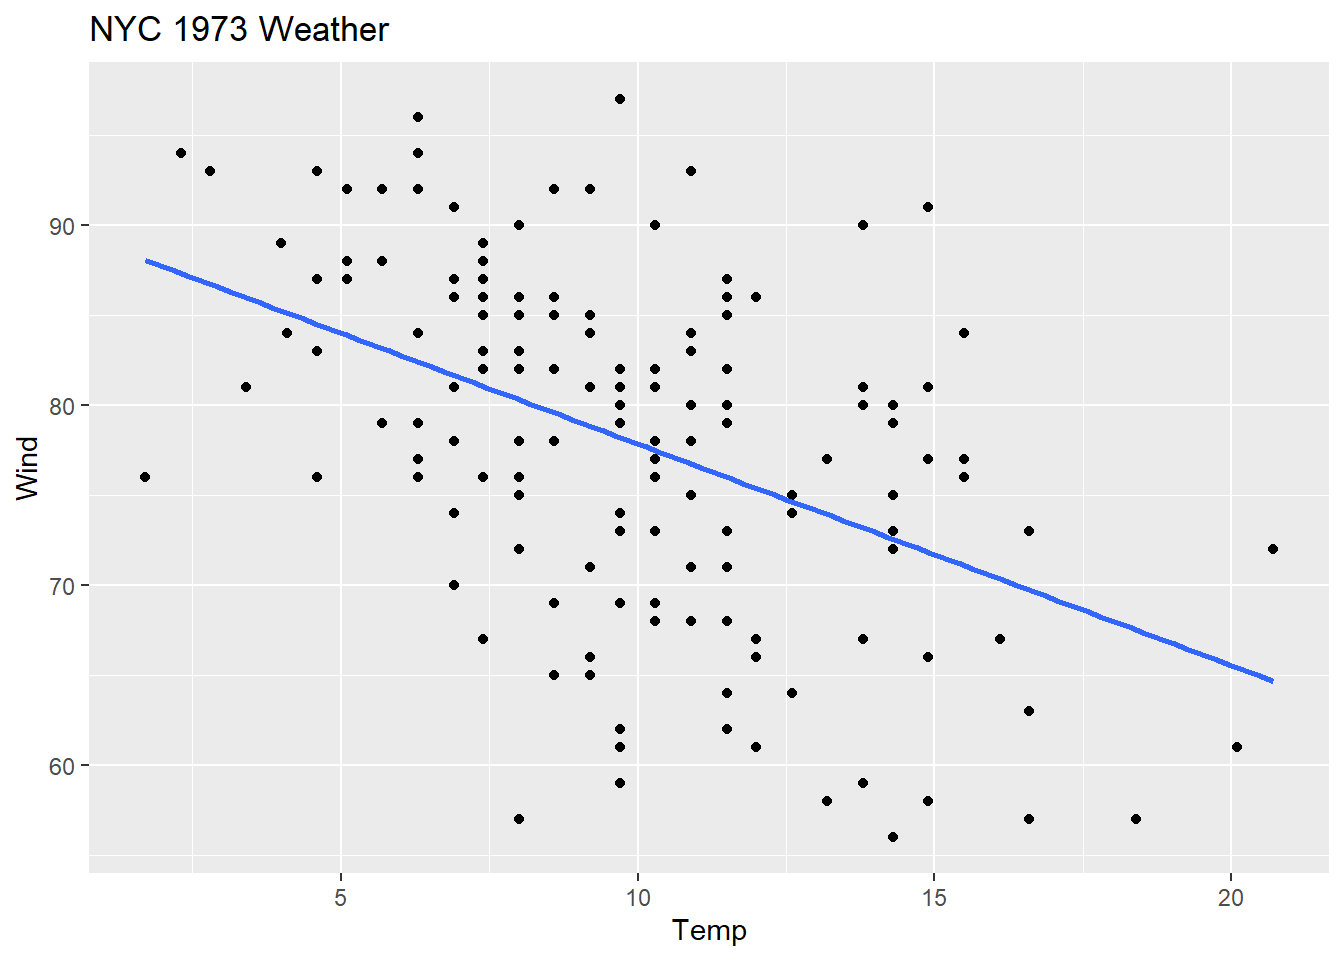
Summary statistics
– correlation (r)
– slope + intercept (fit a line)
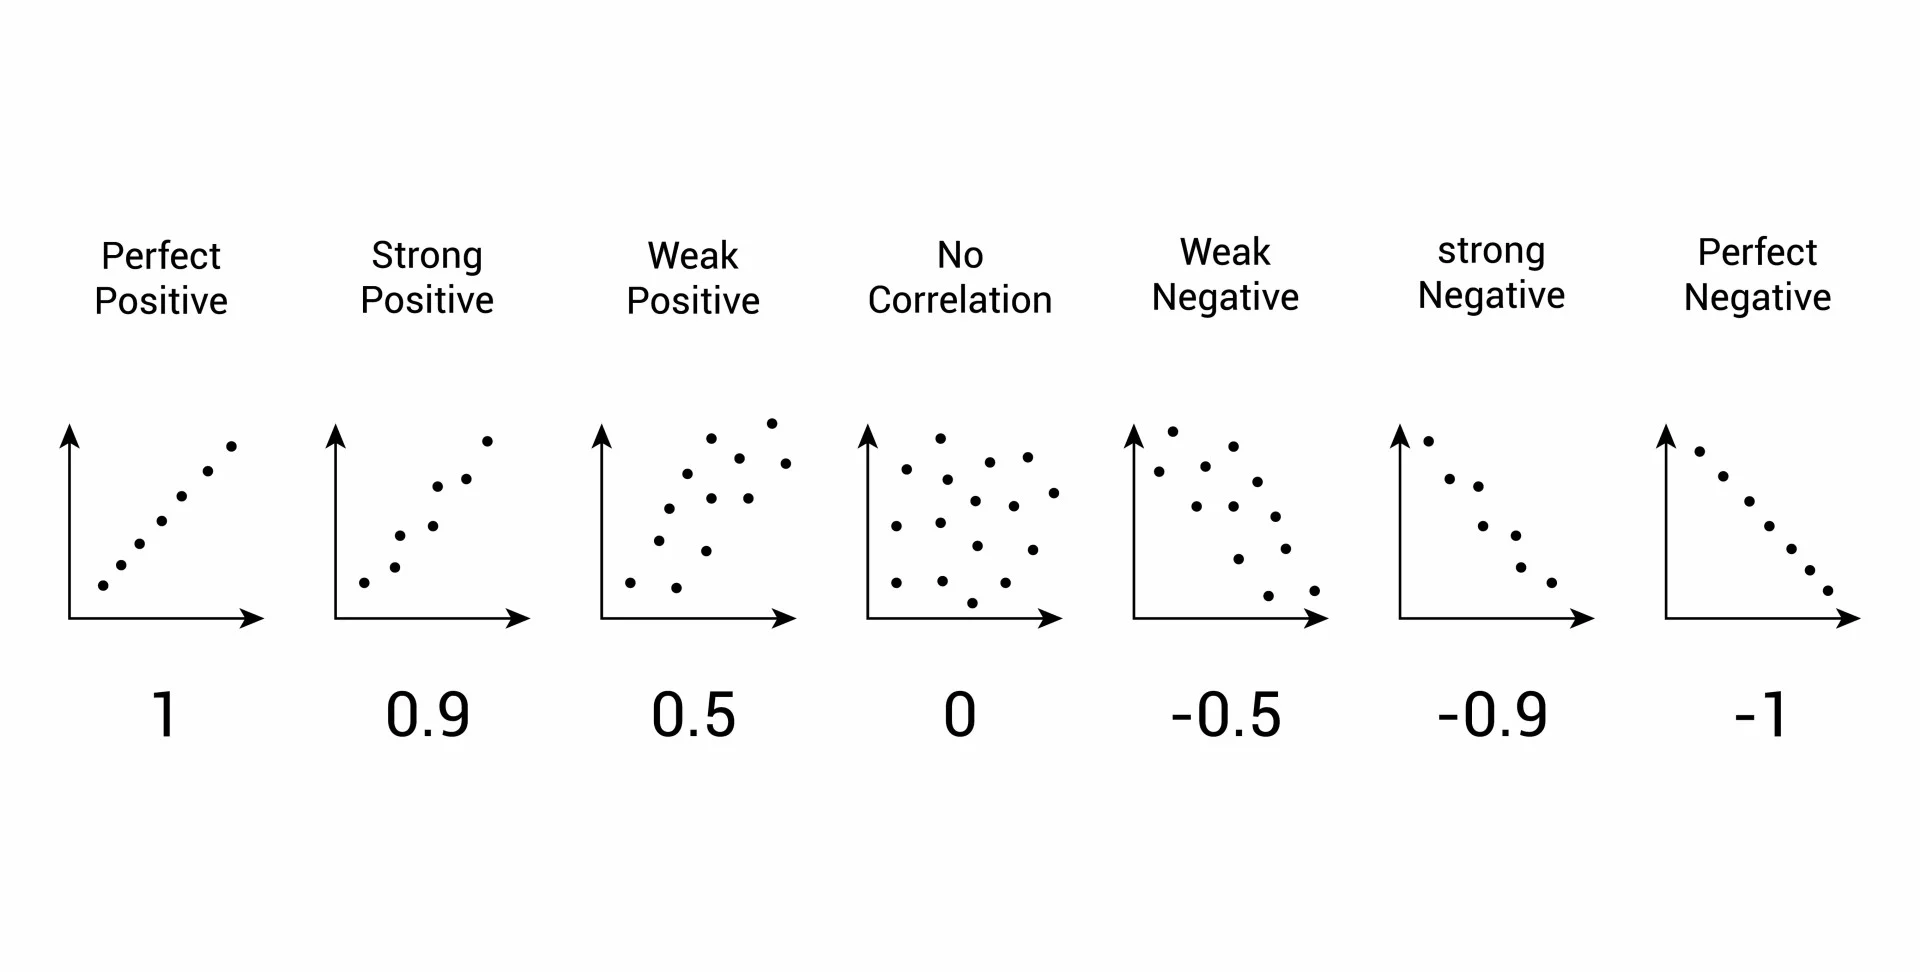
Correlation
– Is bounded between [-1, 1]
– Measures the strength + direction of a linear relationship