# A tibble: 2 × 5
  term        estimate std.error statistic p.value
  <chr>          <dbl>     <dbl>     <dbl>   <dbl>
1 (Intercept)   0.868     0.372       2.34  0.0194
2 age -0.0353 0.0147 -2.41 0.0161Review
Dr. Elijah Meyer
NC State University
ST 511 - Fall 2025
2025-12-01
Checklist
– HW 6 late window (due tonight at 11:59pm)
– Don’t forget about the statistics experience (due tomorrow)
– Final Exam is Dec 8th at 3:30
Final Exam
– Bring a hand-written note sheet (front + back)
– Bring a calculator
Formula sheet
You won’t be given a formula sheet:
– Residual
– How to make a prediction (SLR, MLR, Logistic)
– Confidence interval (general formula)
– Anova table relationships
Final exam strategies
– Highlighter
– Cheat-sheet
Example
Assuming the Central Limit Theorem assumptions are met, what would you expect the shape of the population distribution be of all Iris flower’s petal length?
– Normally distributed
– Left skewed
– Right skewed
– Not enough information to answer the question
Example
The Iris Dataset contains measurements of a flower’s sepal and petal. There are 50 samples for each of the three species of Iris flowers (150 in total across the Iris setosa, Iris virginica and Iris versicolor species). A sepal is the outer parts of the flower (often green and leaf-like) that enclose a developing bud. The petal are parts of a flower that are the pollen producing part of the flower that are often conspicuously colored. The difference between sepals and petals can be seen below.
For this question, we are interested in estimating the mean petal length for flowers. The unit of measurement for petal length is centimeters. See your data table below.
Pick the scenario
You are interested in birds! Specifically, you are interested if the average number of bird visits differ significantly among different types of bird seed.
The researcher sets up 15 identical feeders in similar locations, randomly assigning 5 feeders to each of the three seed types.
Pick the scenario
A furniture retailer wants to understand if their is a relationship between the price of their sofas (usd), and the sofa dimensions (total length in inches). They also have been advised to include Brand Status (A dummy variable: 1 if the sofa is from a premium/luxury brand, 0 otherwise) into their model.
Pick the scenario
At this school, students are given a student-ID at the beginning of the school year, which is used to purchase lunch. Lunch is purchased as normal, and the cash register records a digital record of the purchase. A school cafeteria manager wants to determine the average cost of lunch served last week in the cafeteria.
Pick the scenario
The Donner Party were a group of people who attempted to migrate to California in 1846. They were trapped by an early blizzard on the eastern side of the Sierra Nevada mountains, and before they could be rescued, nearly half of the party had died.
We want to know if age is a good predictor for whether a member of the Donner Party survived, or did not survive.
Logistic Regression
– You can perform hypothesis tests
– You can use the model to make predictions
The model
Write this model in proper notation
Prediction
Use this model to predict the probability of success for a 36 year old.
One-way Anova
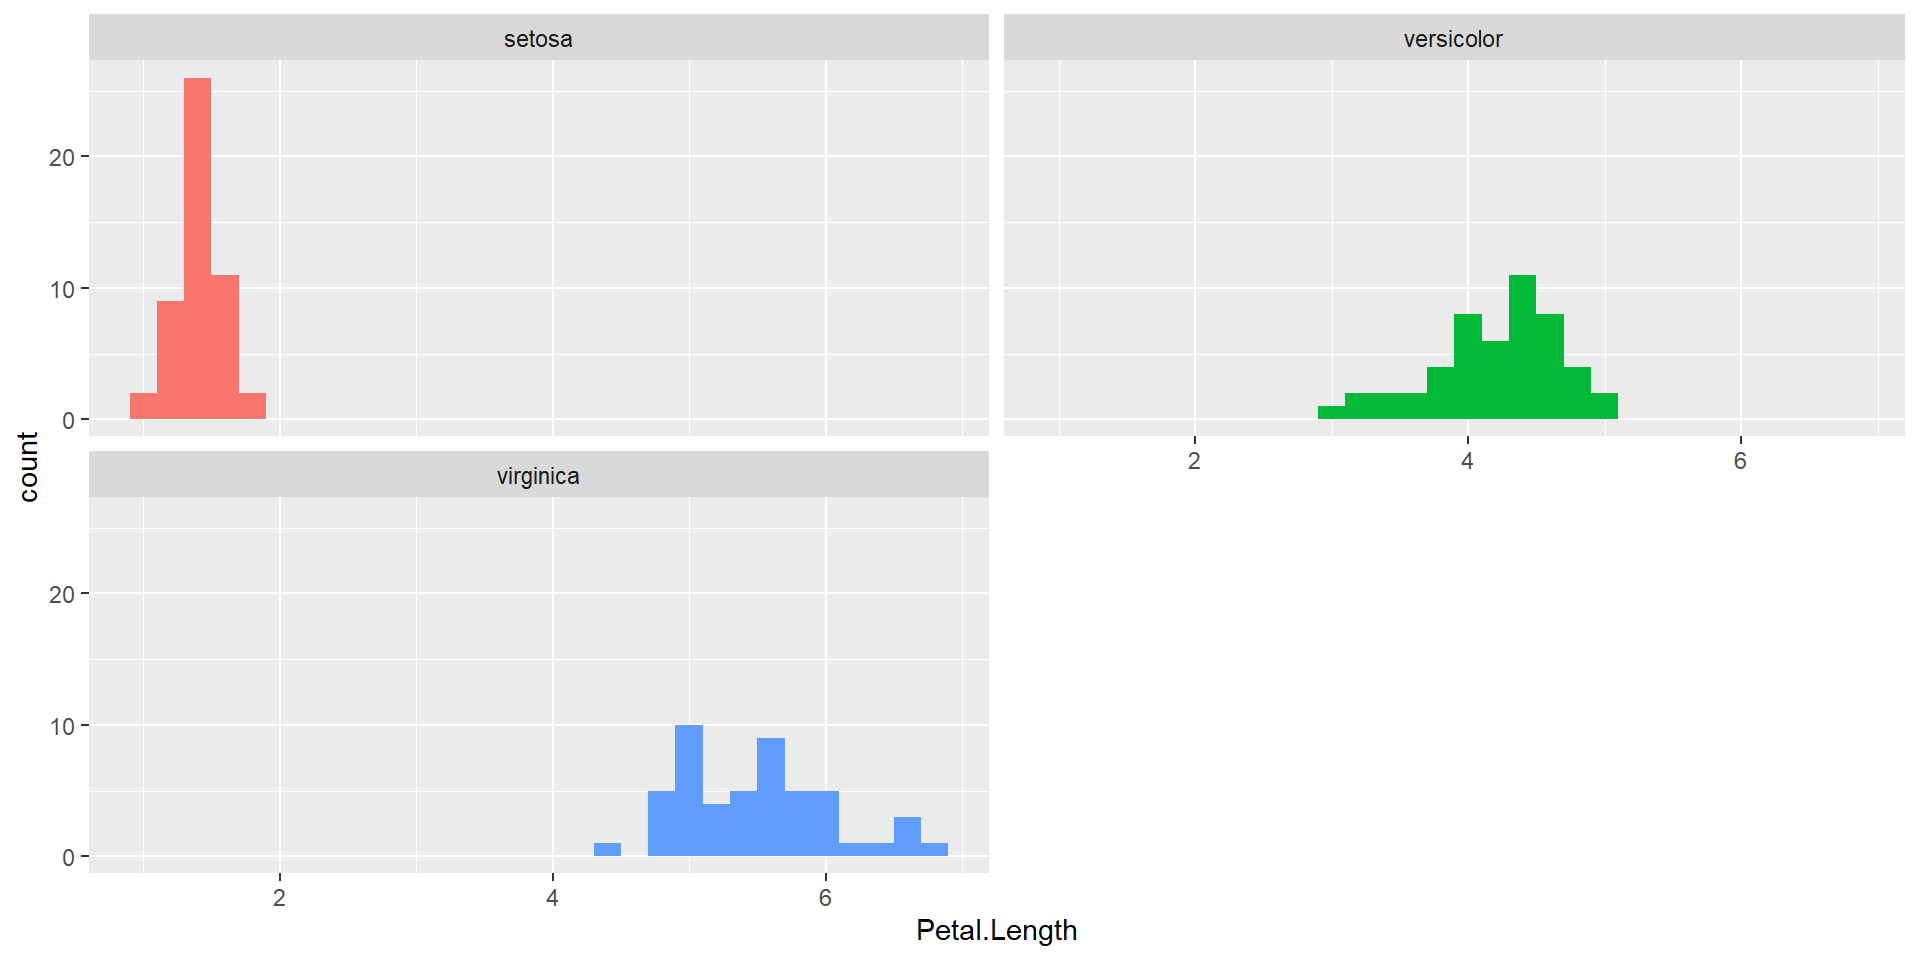
The Iris Dataset contains measurements of a flower’s sepal and petal. There are 50 samples for each of the three species of Iris flowers (150 in total across the Iris setosa, Iris virginica and Iris versicolor species).
We want to investigate if the petal length is different for at least one of these three species. If there is a difference, I want to know which one’s are significantly different.
Hypotheses
\(Ho:\)
\(Ha:\)
Hypotheses
\(Ho:\) All \(\mu_j\) are the same (j = setosa; versicolor; verginica)
\(Ha:\) At least one population mean petal length is different across the three species.
Exploratory Data Analysis
# A tibble: 3 × 4
  Species     mean    sd     n
  <fct>      <dbl> <dbl> <int>
1 setosa      1.46 0.174    50
2 versicolor  4.26 0.470    50
3 virginica   5.55 0.552    50
Assumptions
– ?
– ?
– ?
Assumptions
– Independence
– Normality
– Equal Variance
Normality
Equal Variance
What do we do?
Equal Variance
General rule: Is the largest sample standard deviation more than twice the smallest sample standard deviation?
What would you do (not on exam)
– Welch’s test
– log or square root transformation
– simulation
Anova
# A tibble: 2 × 6
  term         df sumsq  meansq statistic   p.value
  <chr>     <dbl> <dbl>   <dbl>     <dbl>     <dbl>
1 Species       2 437.  219.        1180.  2.86e-91
2 Residuals   147  27.2   0.185       NA  NA
Where do these numbers come from?
How is the p-value calculated?
Decision?
Conclusion?
Interpretation?
Questions
Post-Hoc
Post-Hoc (Tukey’s HSD)
– Why do we need to do this?
– How can we interpret this output?
m1 <- aov(Petal.Length ~ Species, data = iris)

tukey_results <- TukeyHSD(m1)

# Print the results
tidy(tukey_results)
# A tibble: 3 × 7
term contrast null.value estimate conf.low conf.high adj.p.value
<chr> <chr> <dbl> <dbl> <dbl> <dbl> <dbl>
1 Species versicolor-setosa 0 2.80 2.59 3.00 3.00e-15
2 Species virginica-setosa 0 4.09 3.89 4.29 3.00e-15
3 Species virginica-versicol… 0 1.29 1.09 1.50 3.00e-15FWER
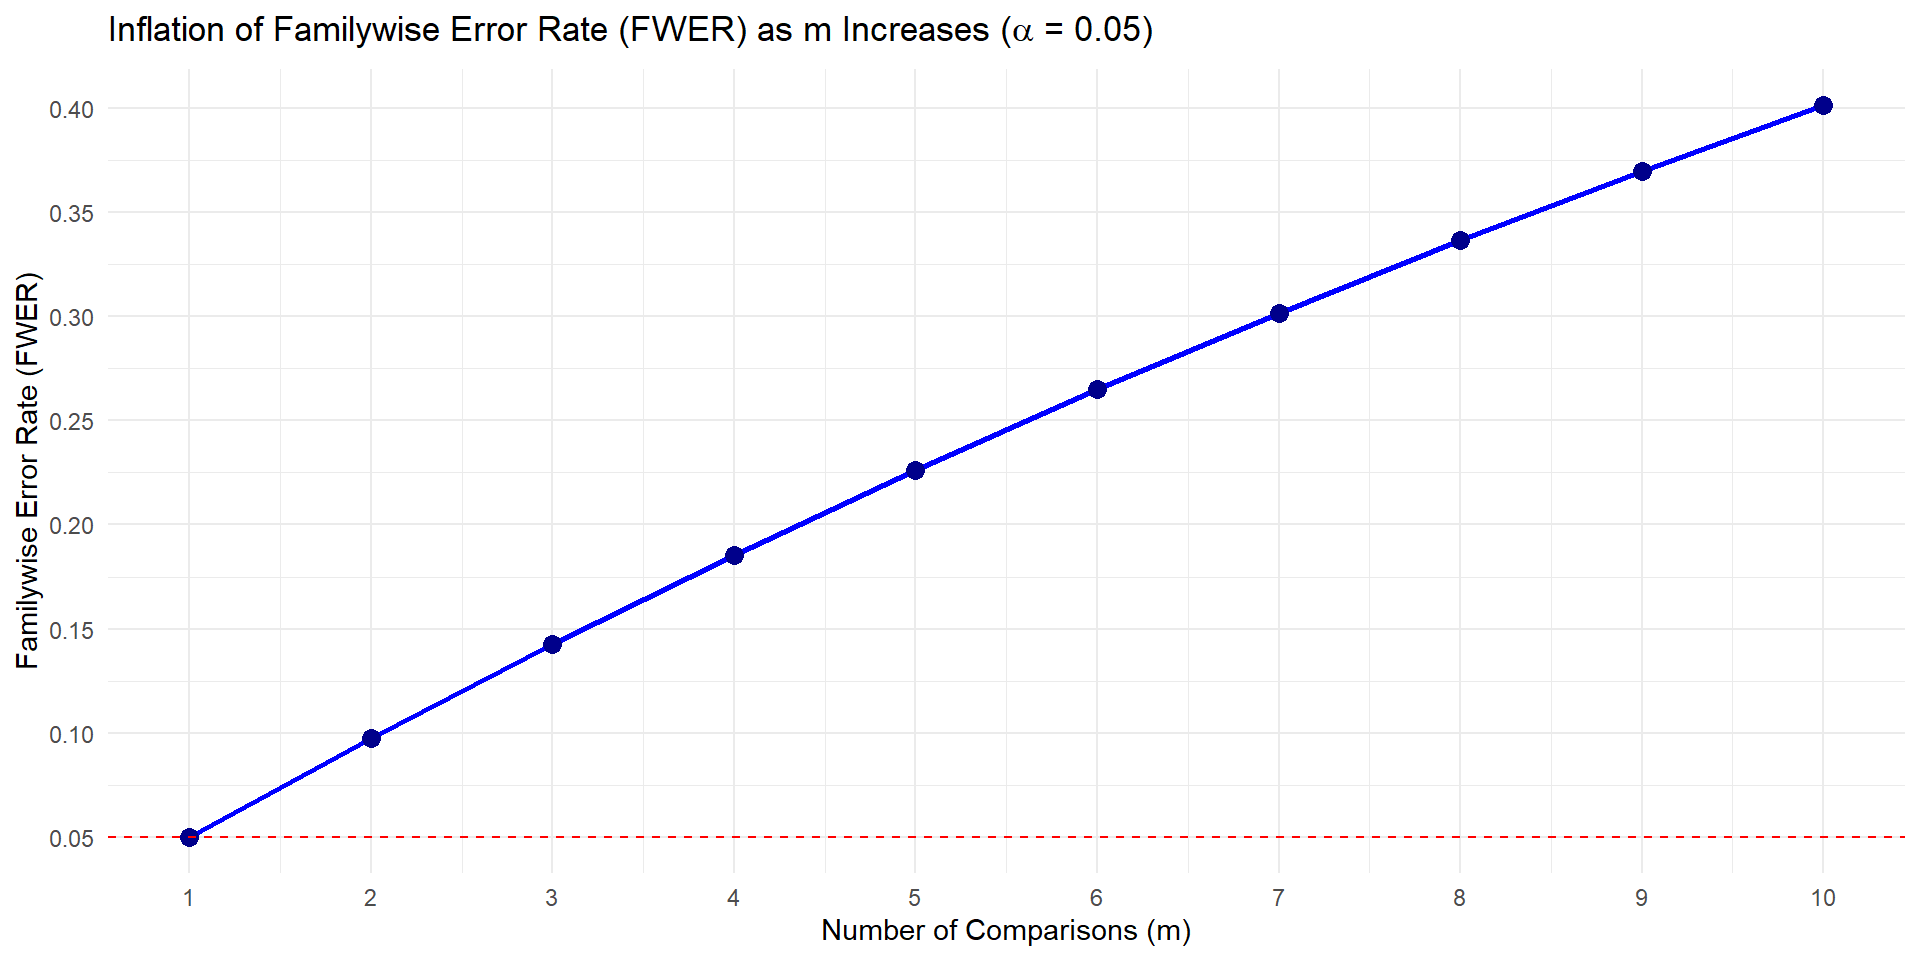
The family-wise error rate (FWER) is the probability of making at least one Type I error (a false positive) when performing a collection of statistical tests.
Family-wise error rate
FWER = \(1 - (1-\alpha)^m\)
where m is the number of comparisons
Family-wise error rate