  See announcement on Moodle
  Today's info will be on exam-1
– Take-home released shortly after
– No Quiz this week
– AE solutions posted
– Homework-3 key posted tomorrow morning
Warm-up
A pharmaceutical company has developed a new, cheaper flu vaccine. To gain approval, they must demonstrate that it is effective for a significant proportion of the population, specifically that its protection rate is higher than 80% (the established industry standard for existing vaccines).
What is the null and alternative hypothesis for this study?
Warm-up
A baseball team analyst wants to determine if their star pitcher, Alex, has experienced a statistically significant decline in his strikeout rate between last season and the current season.
The “success” is defined as a pitch resulting in a strike.
Last Time
We are going to look at Gentoo penguins. It is assumed that Gentoo penguins historically weigh, on average, 6500 grams. You want to test if the Gentoo penguins on an island in Palmer Archipelago, are different than what is historically known.
Relationship between hypothesis testing and confidence intervals
Does 6500 seem like a plausible value? Why or why not?
If the confidence level and \(\alpha\) value “match up” (ex. \(\alpha\) = 0.05 and 95% confidence interval)…
If the hypothesis test leads you to reject the null hypothesis, it means that the distance between \(\bar{x}\) and \(\mu_o\) is greater than the margin of error defined by the 95% CI.
The margin of error for the confidence interval is also the width of the “non-rejection” region.
This inequality states that the distance from the center of the interval to the null value is greater than the margin of error. If the distance to the null is longer than the margin of error around the sample mean, the confidence interval must exclude the null.
Relationship between hypothesis testing and confidence intervals
These two equations are mathematically equivalent, proving that rejecting \(H_o\) is the same as the confidence interval excluding the null value.
Questions
New Context: Same stuff!
Palmer Penguins
Data were collected and made available by Dr. Kristen Gorman and the Palmer Station, Antarctica LTER, a member of the Long Term Ecological Research Network.
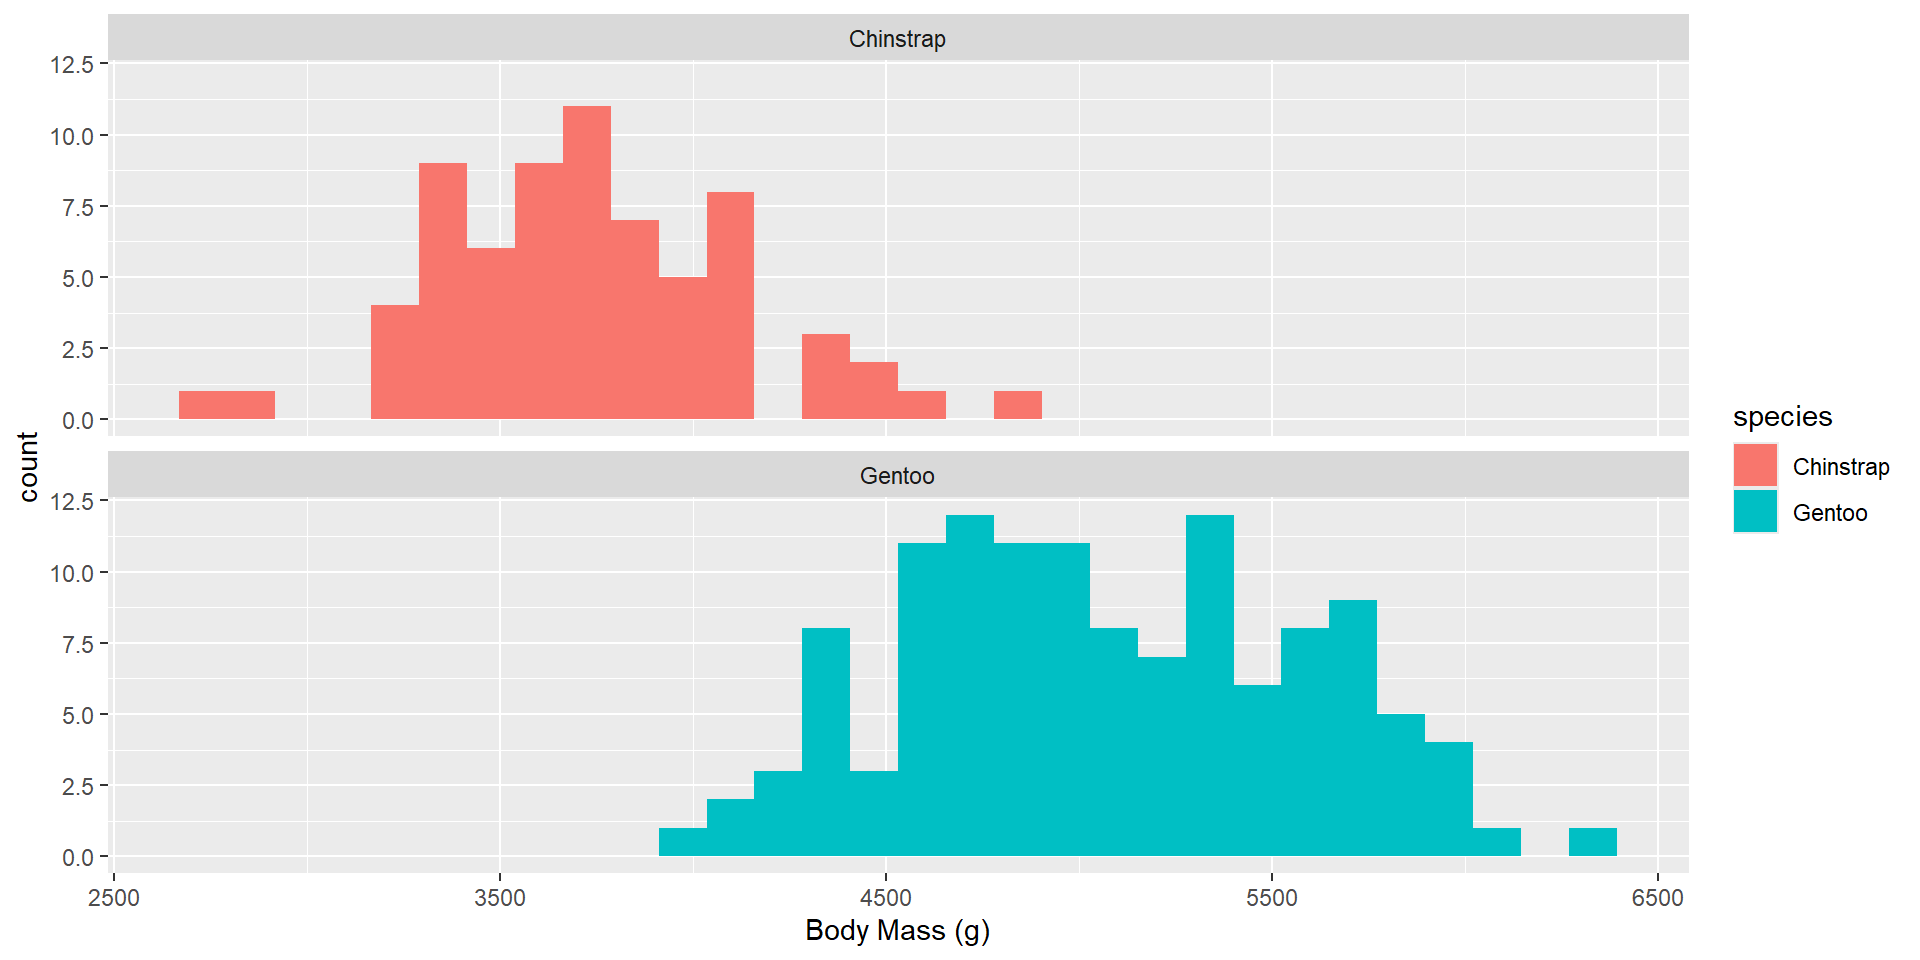
The penguins data set has size measurements for adult foraging penguins near Palmer Station, Antarctica. We want to investigate if the Gentoo penguins have a different body mass than the Chinstrap penguins.
What is our null and alternative hypothesis?
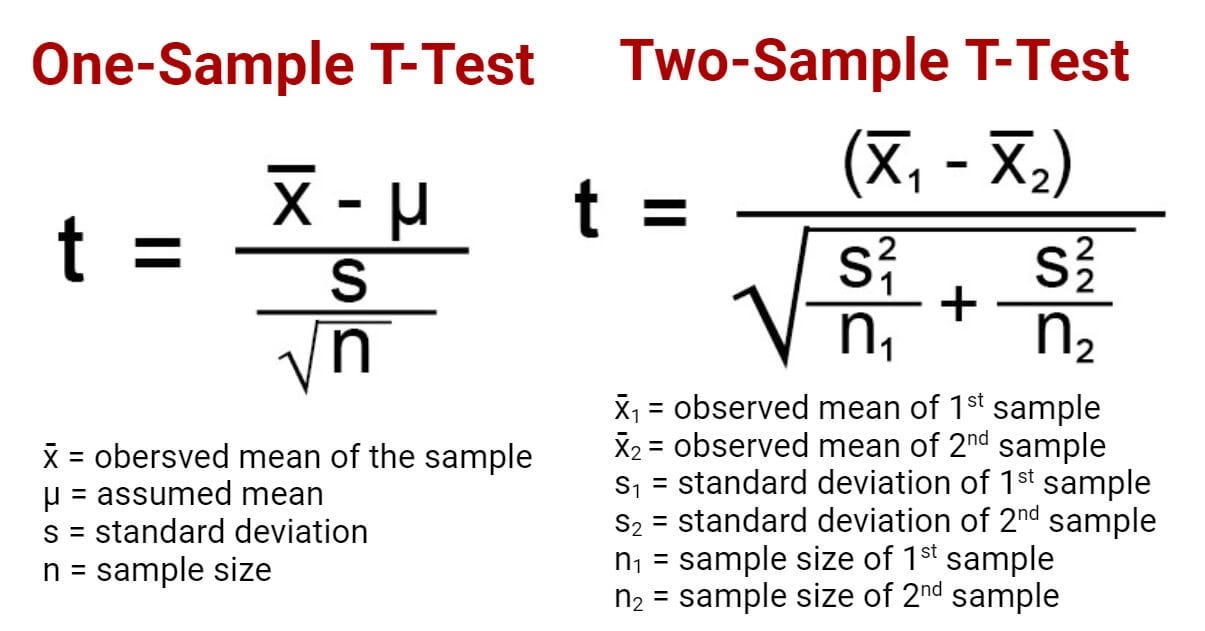
What is the proper notation for our statistic?
The Data
# A tibble: 2 × 3
  species    mean  size
  <fct>     <dbl> <int>
1 Chinstrap 3733.    68
2 Gentoo    5076.   124
We are 95% confident that the true mean bodymass for the Gentoo penguins is 1213.38 to 1472.62 grams HIGHER than the true mean body mass for the Chinstrap penguins.