# A tibble: 6 × 3
# Groups:   species [3]
  species   sex    count
  <fct>     <fct>  <int>
1 Adelie    female    73
2 Adelie    male      73
3 Chinstrap female    34
4 Chinstrap male      34
5 Gentoo    female    58
6 Gentoo male 61Chi-square
Independence vs Goodness of Fit
Dr. Elijah Meyer
NC State University
ST 511 - Fall 2025
2025-10-29
Checklist
– I’m grading your take-homes now
– Quiz released Wednesday (due Sunday)
– Homework released last Friday (due this Sunday) <- new date
– Statistics experience released
– Final Exam is Dec 8th at 3:30
Last Time
Penguins
Suppose that we want to look at the relationship between sex and species. That is, we want to test if species of penguin is independent from sex. How is this different than what we’ve done before?
– Why are chi-square methods appropriate for these data?
– What question does a chi-square test of independence help us answer?
Chi-square test
\(Ho:\)
\(Ha:\)
Chi-square test
\(Ho: \text{sex and species of penguins are independent}\)
\(Ha: \text{sex and species of penguins are not independent}\)
Assumptions
What are they?
Assumptions
– Independence
– Expected frequencies (sample size condition)
Expected counts
With a sample size of 333, what would we expect to see in this table under the assumption that species and sex are independent?
Table of EXPECTED counts
| Male | Female | Total | |
|---|---|---|---|
| Adelie | 146 | ||
| Chinstrap | 68 | ||
| Gentoo | 119 | ||
| Total | 168 | 165 | 333 |
Expected Formula
Expected Table
| Male | Female | Total | |
|---|---|---|---|
| Adelie | 73.658 | (146*165)/333 = 72.343 | 146 |
| Chinstrap | 34.306 | (68*165)/333 = 33.694 | 68 |
| Gentoo | 60.036 | (119*165)/333 = 58.964 | 119 |
| Total | 168 | 165 | 333 |
Are these all larger than 5?
Let’s perform the test
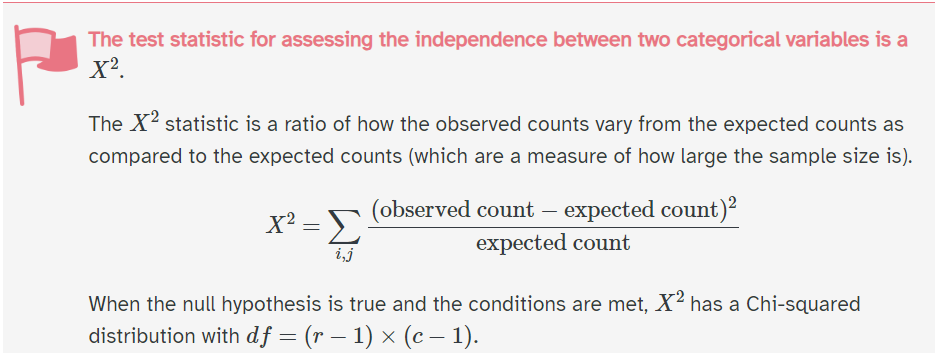
where r is the number of groups for one variable (rows) and c is the number of groups for the second variable (columns)
Chi-sqaure
Chi-sqaure
– The shape of the chi-square distribution curve depends on the degrees of freedom
– Test statistic can not be negative
– The chi-square distribution curve is skewed to the right, and the chi-square test is always right-tailed
– A chi-square test cannot have a directional hypothesis. A chi-square value can only indicate that a relationship exists between two variables, not what the relationship is.
Questions
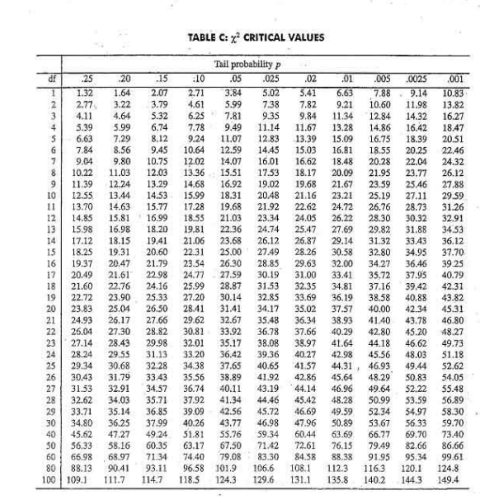
Calculating a p-value
You can use a table.
Calculating a p-value
We can use R.
Proper notation
P(\(\chi^2 \geq X^2\)) = p-value
The probability of observing our statistic, or something larger given the null hypothesis is true.
\(\chi^2\) = map of possible outcomes on the chi-sq distribution (random variable because it is generated from a random process)
\(X^2\) = your statistic calculated
Let’s talk about it
Decision?
Conclusion?
Let’s talk about it
Fail to reject the null hypothesis
Weak evidence to conclude that species has an impact on sex
Can we use chi-square in a difference in proportions setting?
Yes, and there is a connection between the two distributions (z vs \(\chi^2\))
Concept of the proof
The Chi-Square formula: \[\chi^2 = \frac{(O_A - E_A)^2}{E_A} + \frac{(O_B - E_B)^2}{E_B} + \frac{(O_C - E_C)^2}{E_C} + \frac{(O_D - E_D)^2}{E_D}\]
Because the terms are related by the fixed marginal totals (the degrees of freedom are = 1), it can be shown that this sum of 4 dependent terms is algebraically equivalent to the square of a single standard normal variable (\(Z^2\)):\[\chi^2_{\text{1}} = Z^2\]
Let’s go through an example where \(Z^2\) = \(\chi^2\)
Let’s show it
vs Engine (0 = V-shaped, 1 = straight) (response) am Transmission (0 = automatic, 1 = manual) (explanatory)
# A tibble: 4 × 3
# Groups:   vs [2]
  vs    am        n
  <fct> <fct> <int>
1 0     0        12
2 0     1         6
3 1     0         7
4 1     1         7
How do we calculate a z-statistic?
Z-statistic
\[ Z = \frac{(\hat{p}_1 - \hat{p}_2)}{\text{SE}_{\text{pooled}}} = \frac{(0.5385 - 0.3684)}{0.1786} = \frac{0.1701}{0.1786} \approx 0.952 \]
\(.952^2 = .906\)
Questions?
Goodness of Fit Test
Slight variation to our last example.
Last time: We had two categorical variables with r and c levels.
This time: we compare a single sample from one population with a hypothesized distribution.
Example
You suspect a six-sided die is loaded. You decide to roll it 60 times and record the outcome of each roll.
What’s my variable?
What would the hypothesized distribution for the die?
Null and alternative
Ho: The die is fair. The observed frequencies follow the uniform theoretical distribution (i.e., all six sides have an equal probability of 1/6).
Ha: The die is not fair. The observed frequencies do not follow the uniform distribution.
What would our expected count be?
How do our assumptions look?
Data
  Side Observed Expected Hypothesized_P
1    1        8       10      0.1666667
2    2       12       10      0.1666667
3    3        7       10      0.1666667
4    4       15       10      0.1666667
5    5       11       10      0.1666667
6    6        7       10      0.1666667
How do we calculate our chi-squared statistic?
Results
    Chi-squared test for given probabilities

data:  observed_counts
X-squared = 5.2, df = 5, p-value = 0.392
where we now just have k-1 degrees of freedom
Extension
It doesn’t have to be uniform. You can specify the distribution (what you would expect), and perform the test!