Write out the appropriate null and alternative hypothesis to the context below:
A factory that produces electronic components has a historical defect rate of 5%. After implementing a new manufacturing process, they want to know if the defect rate has gone down. They test a random sample of 250 components from the new process and find that 8 of them are defective.
Warm up
\(H_o\): \(\pi = 0.05\)
\(H_a\): \(\pi < 0.05\)
\(\hat{p}\) = \(\frac{8}{250}\)
Warm up (together)
Suppose a p-value was calculated to be < 0.001. At an \(\alpha\) value of 0.05, write a decision and conclusion in the context of the problem.
– What is a decision?
– What is a conclusion?
– What is \(\alpha\)?
Decision
Reject or Fail to Reject the null hypothesis
Conclusion
Strong or weak evidence to conclude the alternative hypothesis
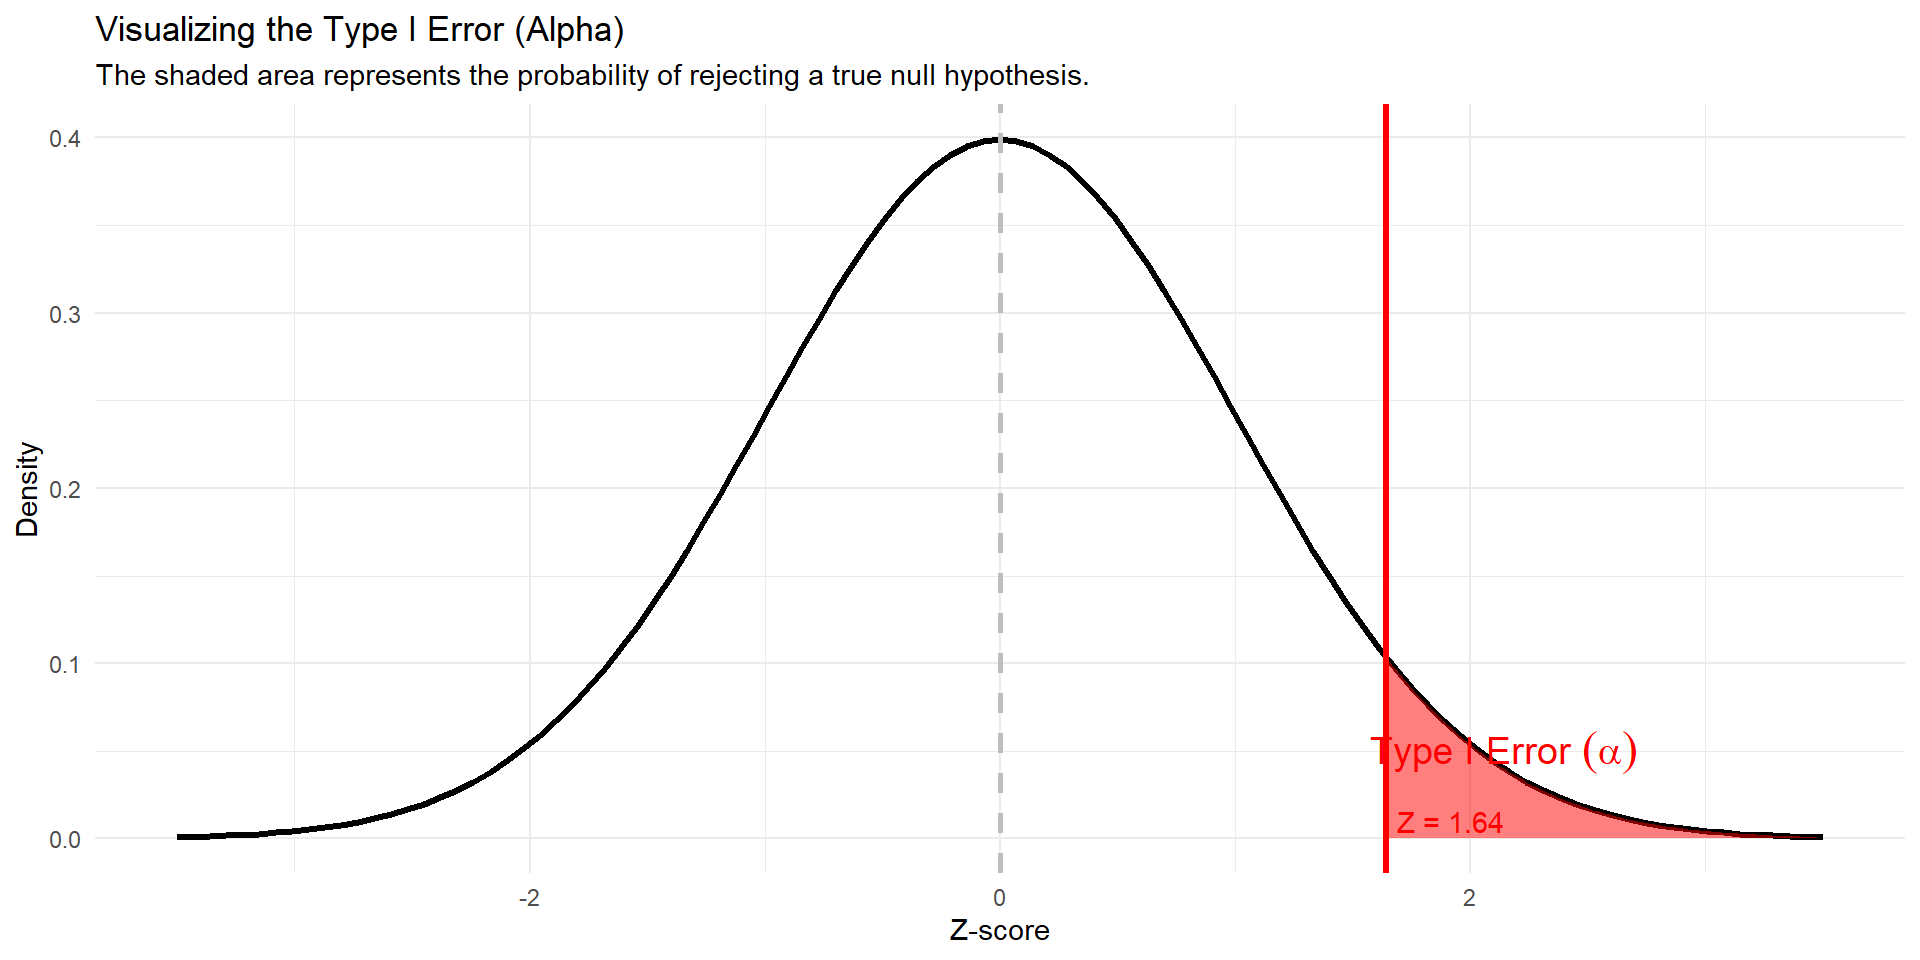
alpha
\(\alpha\) is the probability of rejecting the null hypothesis when the null hypothesis is actually true.
\(\alpha\) is the probability of a type 1 error
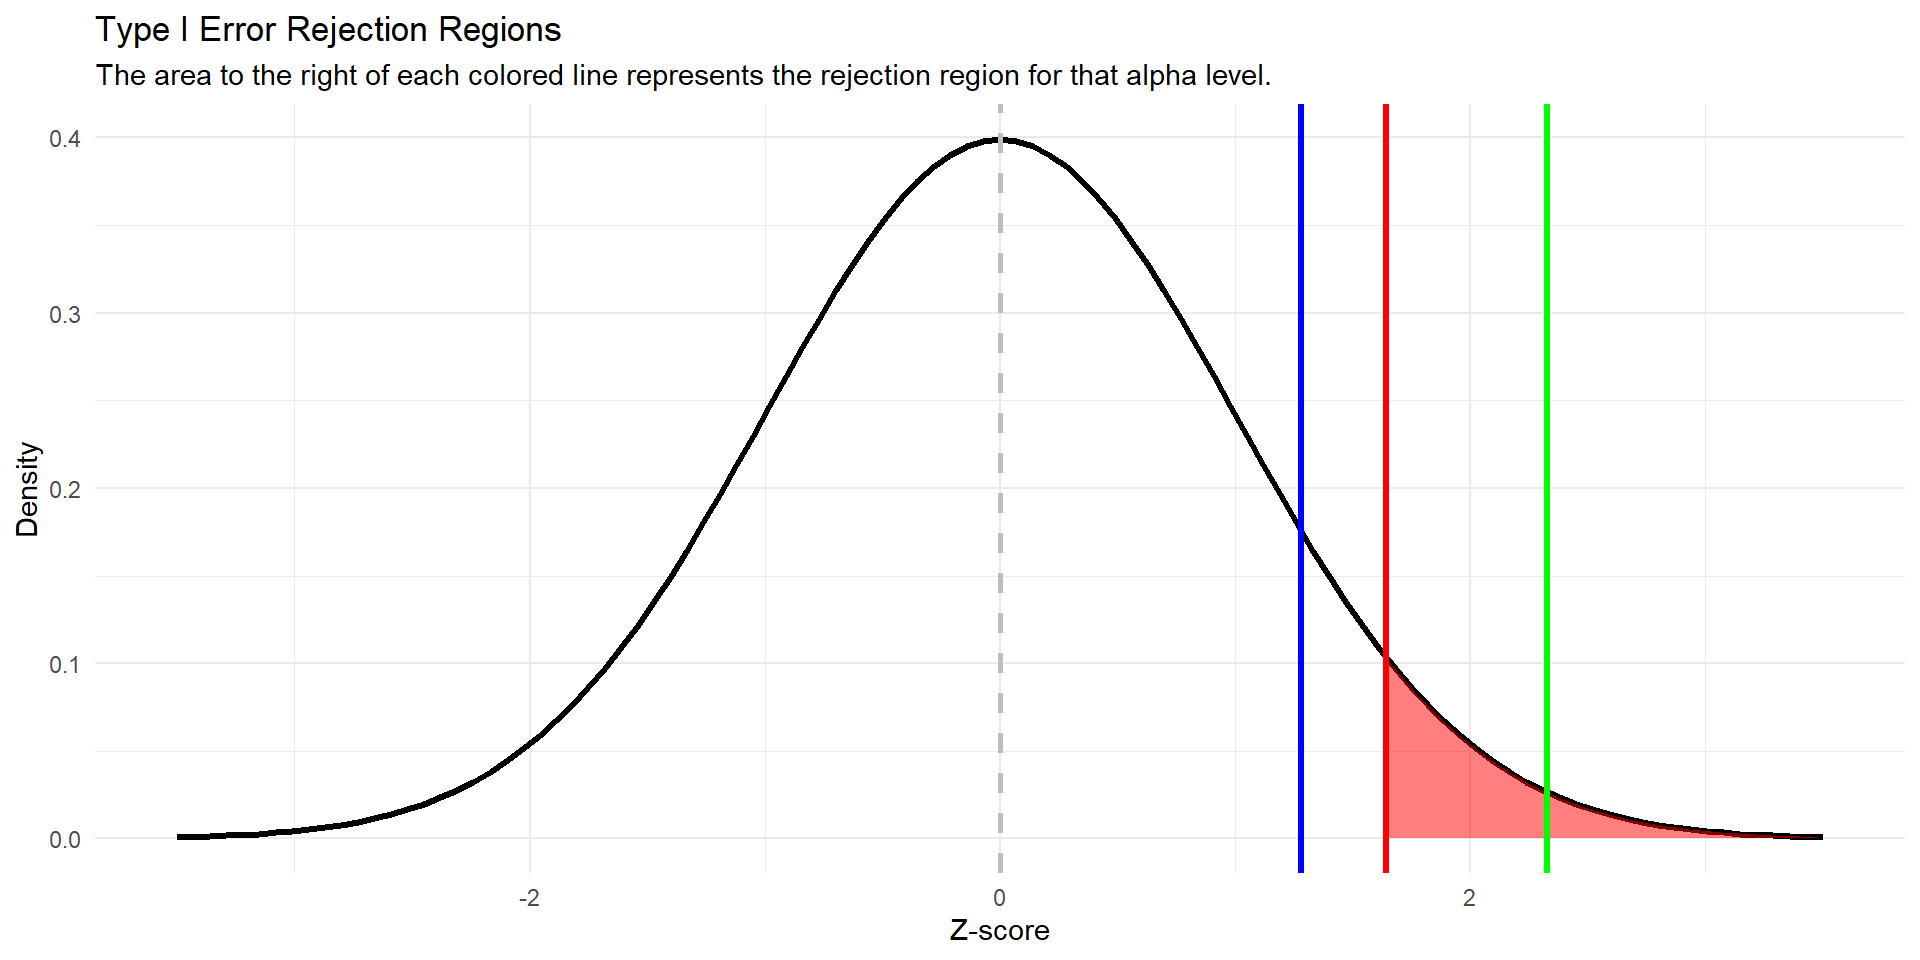
alpha
for a right tailed test…
\(\alpha = 0.01; 0.05, 0.1\)
Exercise-5
Warm up
What does a hypothesis test allow us to do?
How is this different than a confidence interval?
Warm up
Hypothesis Test: We want to test against some value
vs
Confidence interval: We want to estimate what the population paramater actually is
Motivation
What’s the true average battery life (in hours) for a Google Pixel 9 cell phone?
Guesses?
Do you feel good about your guess?
Motivation
Suppose you took a random sample of 40 phones and calculated \(\bar{x}\) to be 18.5 hours.
How comfortable do you feel saying \(\mu\) = 18.5?
Motivation
Suppose you took a random sample of 40 phones and calculated \(\bar{x}\) to be 18.5 hours.
How comfortable do you feel saying \(\mu\) = 18.5?
Well this is our best guess for what \(\mu\) could be…. but
not really confident….. because sampling variability exists!
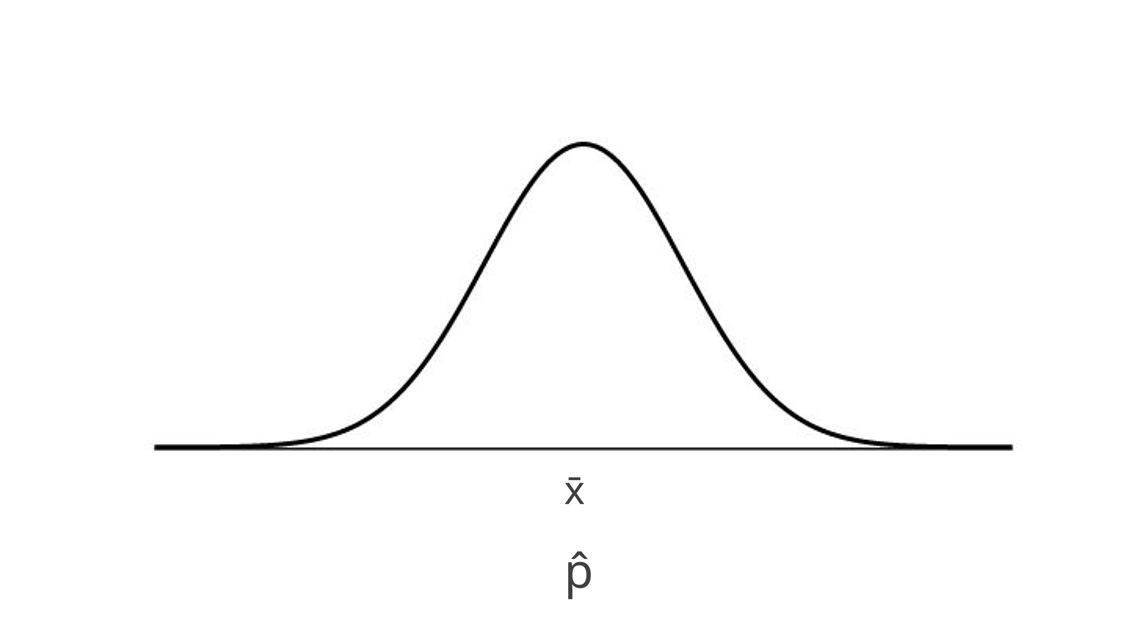
Confidence Interval Goal
We want to create a sampling distribution around our statistic, and use the standard error (sampling variability) to provide a range of values to estimate our population parameter.
Howling Cow Example
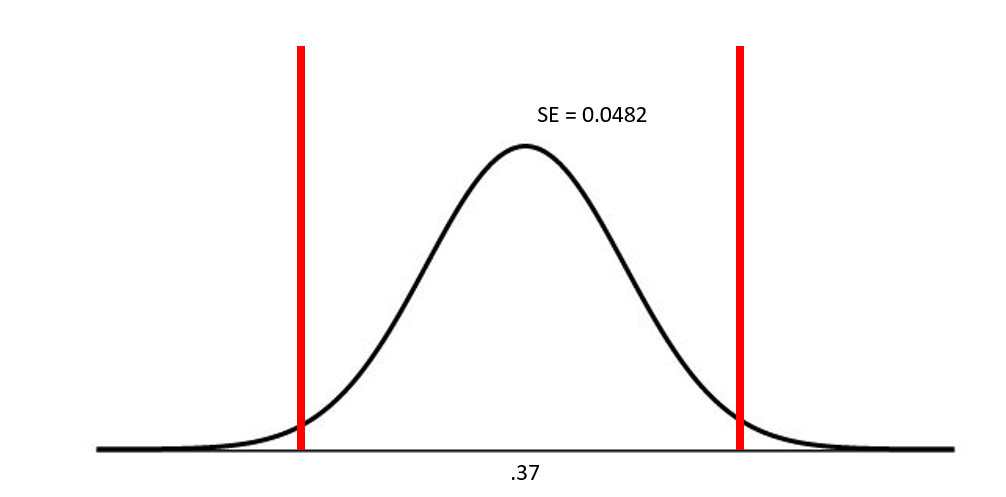
We want to estimate the number of NC State students that eat ice creme. Let’s assume that 100 NC State students were randomly sampled, and it turned out that \(\hat{p}\) = .37. This is our best guess for \(\pi\), which nobody thinks is actually correct.
Checking Assumptions
We need to make sure we understand how our sampling distribution will look, so we check assumptions!
– Independence (same as hypothesis testing)
– success-failure (sampling size); slightly different than hypothesis testing
success-failure
– Hypothesis testing: successes and failures under the assumption of the null hypothesis
– Confidence interval: successes and failures from our random sample
Howling Cow Assumption Check
– Independence (how do we feel/can we justify?)
– Success Failure (let’s calculate)
\(\hat{p} = .37\)
n = 100
Howling Cow
Because our assumptions are satisfied, we know that our sampling distribution will be ~ Normal, and we can estimate the standard error of our sampling distribution as follows:
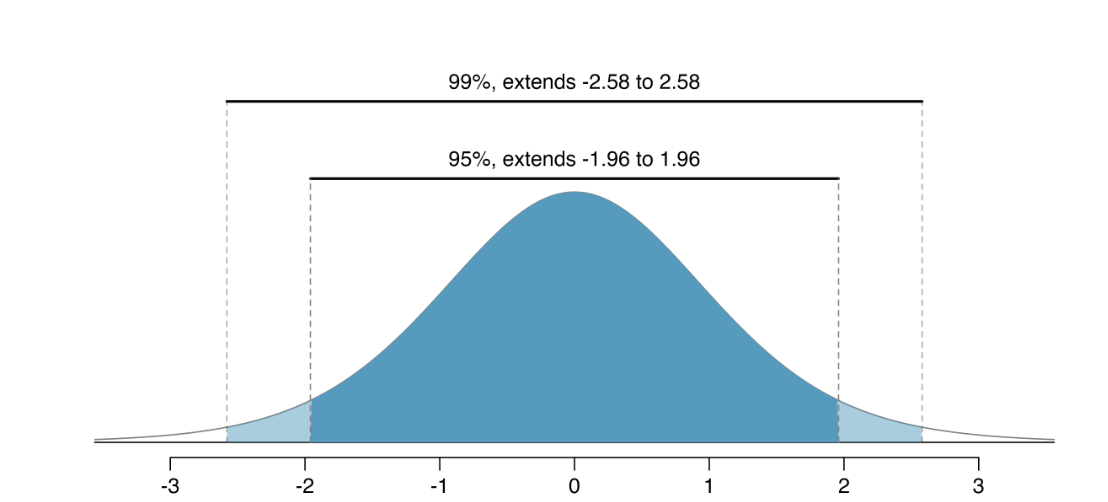
Show, using qnorm, the z* cutoff values for 90%, 95%, and 99%
Calculate a 95% confidence interval
Knowing \(\hat{p}\), \(SE(\hat{p})\), and the multiplier, calculate the 95% confidence interval.
Calculate a 95% confidence interval
\(\hat{p} \pm z^* * SE(\hat{p})\)
.37 \(\pm\) 1.96*0.0428
.37 \(\pm\) 0.084
.37 + 0.084 = 0.454
.37 - 0.084 = 0.286
(0.286, 0.454)
Talk about it
How do we interpret our confidence interval of (0.286, 0.454)?
We are 95% confident that \(\pi\) is within (0.286, 0.454).
We are 95% confident that the true proportion of NC State students who eat Howling Cow ice creme at dinner is between 0.286 and 0.454.
Questions?
Questions
– What changes as we go from a 95% CI to a 99% CI?
Center? Spread?
Difference in proportions
What happens when we work with two variables?
– What’s the same?
– What’s different?
Example
A school wants to evaluate a new online math curriculum. To see if it is more effective than the traditional textbook, they randomly select two groups of students.
Group 1 (New Curriculum): Out of 150 students, 110 earned a grade of A or B; Group 2 (Traditional Textbook): Out of 120 students, 78 earned a grade of A or B.
Perform a hypothesis test to determine if the proportion of students earning an A or B is significantly higher for the new online curriculum
– What’s our variable(s)?
– Null and alternative hypothesis?
– Statistic?
Example
A pharmaceutical company is conducting a clinical trial to test the effectiveness of a new drug for a common illness. They randomly assign participants to one of two groups
Group 1 (New Drug): Out of 200 patients, 160 recovered from the illness.
Group 2 (Placebo): Out of 180 patients, 126 recovered from the illness.
Perform a hypothesis test to determine if the proportion of patients who recovered is significantly different for the group that received the new drug
– What’s our variable(s)?
– Null and alternative hypothesis?
– Statistic?
Example
A farmer wants to know if a new, organic fertilizer (Fertilizer B) is as effective as their current standard fertilizer (Fertilizer A). They divide a large field into two sections and randomly apply one of the two fertilizers to each section. At harvest time, they take random samples of crop yield (in bushels per acre) from each section.
From Sample A (Fertilizer A), they took a sample size of 30 and harvested a mean crop yield of 85. In Sample B (Fertilizer B), they took a sample of size 30 and harvested a mean crop yield of 89.
Perform a hypothesis test to determine if the average crop yield from Fertilizer B is significantly higher than that from Fertilizer A